Brief annotation
About the document
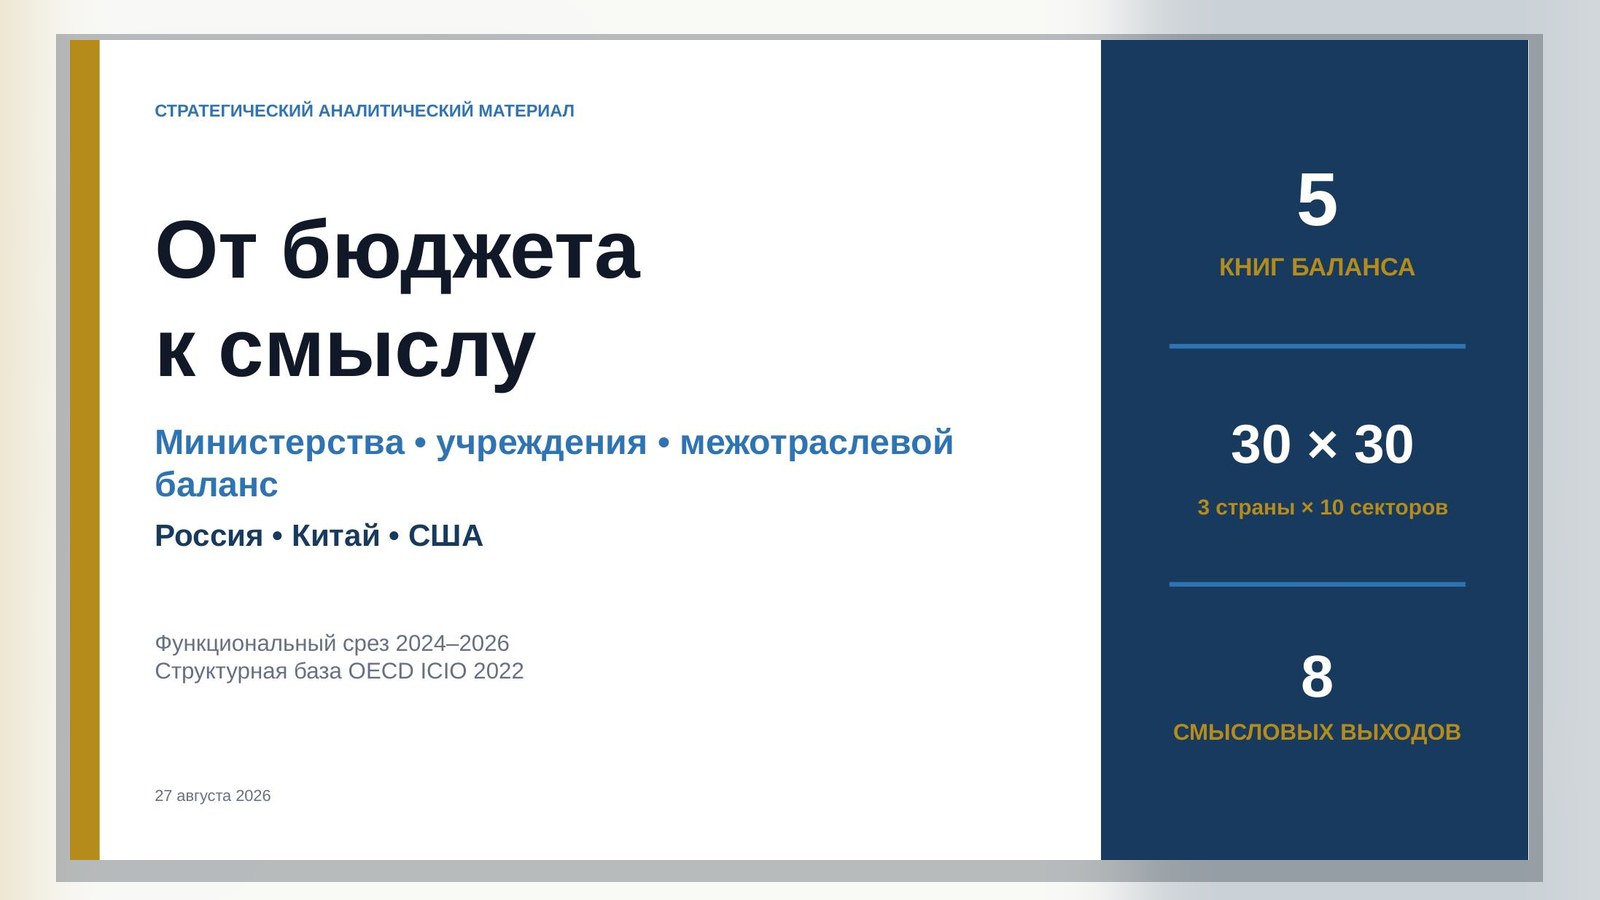
A model of the distribution of functions and meanings between ministries and institutions in a single intersectoral balance.
Ministerstva_Uchrezhdeniya_Mezhotraslevoi_Balans_Smysly_2026.pptx
Downloading the document...
Russia • China • USA
Resource → program → industry → result → public ability
Analytical section: 2024–2026
27 August 2026
Official statistics, estimated shares and author's standardized models are shown separately. Scenario indexes are not ratings of states.
Summary for decisions
| 30 × 30 the Intercountry Model Core 3 Countries × 10 Sectors | 2,06 issue multiplier author balance 100 units | 55,9 → 60,0 The meaning index of the three 25% Closing the Gap | 4,1 p.p. break-even coordination after - negative effect |
|---|
| The Ministry’s money cannot be directly attributed to industry or public utility. The working bridge consists of five transitions: Office → program → product or service → industry → independent result → meaning. |
|---|
- A federal or general budget line shows the input of the resource, but not the scale of the managed production. This is especially important for Treasury, HHS, USDA, Ministry of Finance and Social Funds.
- In the author’s inter-industry scenario, the highest physical multipliers are machines and electronics (2,45), materials and chemistry (2,36), other industry (2,31) and construction (2,28).
- The main system bottleneck is ICT, finance, software platforms and business standards: index 100 with a lower multiplier 1,74. The information layer converts the separate power into a reproducible circuit.
- Scientific academies, universities and laboratories should be conducted by a satellite circuit of knowledge. Publication and patent - release; implemented technology, reduced risk or open standard - the final semantic output.
- Demonstration synchronization that closes 25% breaking to the best practice of the three, increases the average semantic index with 55,9 to 60,0: +4,1 paragraph, or +7,4% to the base. This is not a monetary estimate or an official rating.
- Value added and damage prevented are used for monetary utility estimation; gross output cannot be summed up due to double counting of raw materials and semi-finished products.
What is Balanced
One control object should be seen in five books at once. Only such an architecture separates consumption, physical release, the state of the system, and the social outcome.
| Book | Contents | Unit | Control of double account |
|---|---|---|---|
| 1. Fiscal entrance | Budget allocations, transfers, taxes, purchases | Rubles / Yuan / Dollars; % of GDP | Do not mix the federal, general and consolidated perimeter |
| 2. Financial balance | Loans, guarantees, funds, assets and liabilities | stock and flow; risk; term | Credit and guarantee are not equal to cost |
| 3. Intersectoral flow | Goods and services between sectors, imports, value added | Z, A, L=(I−A)⁻¹ | Do not add up gross output with added value |
| 4. Physical result | MW, TW·h, t, km, beds, years of life, recovery time | volume, quality, availability | Cash performance does not prove the result |
| 5. The Meaningful Exit | Sovereignty, reproduction, option, sustainability, trust, development, security, common good | Independent KPI 0–100 | Don't attribute causality without an evaluation design |
| OVERALL FORMULA m = H · Q · (I − A)⁻¹ · G · b − r, where b is the budget impulse, G is the bridge to sectors, Q represents outcome coefficients, H is the map of meanings, and r represents risks and coordination costs. |
|---|
Comparability of three states
Figure 1. The close scale of spending does not mean the same structure of the stateRU03–RU05; CN01, CN03; US01]
| Issue addressed | Difference | Rule |
|---|---|---|
| Budget | Russian Federation: Federal; PRC: general public budget; United States: federal outlays | Compare as a macro-scale, but not as a consolidated share of the state |
| Year | Calendar 2024/2025; United States - Fiscal Year | Requires FY and calendar year marking |
| Function / Office | Functional section and agency costs do not match | Treasury includes debt service; HHS transfers and insurance |
| Price | National currencies and current prices | Shares of GDP are acceptable; direct addition of currencies is not |
| Expenses/issues | Total year OECD ICIO - 2022; national tables newer | General model 2022, current KPI — satellite updates |
| Result | Release, Outcome, and Social Ability - Different Levels | Budget is not KPI results |
Equivalent functional contours
| Function | Russia | China | USA |
|---|---|---|---|
| Finance and macro balance | Ministry of Finance; Treasury; FNS; FCS; Bank of Russia; Rosstat | MoF; PBOC; STA; GACC; NBS; NDRC | Treasury; Fed; IRS; OMB; BEA; Census; BLS |
| Science and education | Ministry of Education; Ministry of Education; RAN; RSF | MOST; MOE; CAS; NSFC | NSF; NIH; NASA; DOE Science; DARPA; National Academies |
| Industry and trade | Minpromtorg; FRP; Rosstandart; REC | MIIT; MOFCOM; SAMR; NDRC | Commerce/NIST/BIS/ITA; USTR; SBA; EXIM |
| Energy | Ministry of Energy; Rosatom; Rostekhnadzor; SO UES | NEA; NDRC; SASAC; State Grid | DOE; EIA; FERC; NRC; DOI |
| Transport and logistics | Mintrans; Rosavtodor; Russian Railways; Avtodor | MOT; CAAC; NRA; China Railway | DOT; FHWA; FAA; FRA; FTA; MARAD |
| APC and food | Ministry of Agriculture; Rosselkhoznadzor; Rosrybolovstvo | MARA; NFGA; SAMR | USDA; ERS; NASS; ARS; FNS; FSIS |
| Health and demographics | Ministry of Health; FOMS; Ministry of Labor; SFR; Rospotrebnadzor | NHC; NHSA; MHRSS; MCA; China CDC | HHS; CMS; CDC; FDA; NIH; SSA |
| Defence and security | Ministry of Defence; MIA; FSB; Rosgvardia; EMERCOM | CMC; MND; MPS; MEM; MSS | DoD; DHS; DOJ/FBI; FEMA; Intelligence Community |
| Ecology | Ministry of Environment; Rosprirodnadzor; REO | MEE; NDRC; NEA; NFGA | EPA; NOAA; DOI/USGS; DOE; FEMA |
| Digital management | Mincifers; Roskomnadzor; GoTech | CAC; MIIT; NBS; SAMR | OMB CIO/OIRA; GSA/TTS; CISA; NIST; NTIA |
This is a functional conformity, not a statement of equal authority.
Three Numerical Signal Structure
Figure 2. R&D and defense show different modes of option creation and securityCN01, CN04; RU13; US01; WB01]
| Country | Public scale | Security | Knowledge | Balance diagnosis |
|---|---|---|---|---|
| Russia | Federal expenses 40,192 trillion rub. = 19,9% GDP (2024) | Defence 10,77 trillion rub. = 5,32% GDP (2024) | R&D ≈0,94% GDP (WDI, 2024) | Defense is the main federal absorber; bottleneck is civic diffusion of knowledge |
| China | General public budget 28,7395 trillion RMB = 20,50% GDP (2025) | Defence 1,7847 trillion RMB = 1,27% GDP (2025) | R & D 3,9262 trillion = 2,80% GDP (2025) | Public science is complemented by a large corporate and regional contour |
| USA | Federal outlays $6,735 trillion = 23,3% GDP (FY2024) | National defense $873,5 billion = 3,0% GDP | R&D ≈3,45% GDP (WDI, 2023) | Interest $879,9 billion are already comparable to defense; science is concentrated in DoD and HHS |
Russia: Balance on functional contours
Reference scale: revised GDP for 2024 — 202.32 trillion rubles; forecast GDP for 2026 — 235.1 trillion rubles. The shares are calculated using these official baseline values.
| Function and institutions | Resource / budget | Measurable output | The Meaningful Exit |
|---|---|---|---|
| Finance: Ministry of Finance, Treasury, Federal Tax Service, FCS, Bank of Russia, Rosstat | 40,192 trillion Rubles of federal expenses = 19,9% GDP, 2024 | Inflation 9,52%; single budget and statistical contour | Price of time, predictability, trust [RU03-RU05] |
| Science and education: Ministry of Education, Ministry of Education, Russian Academy of Sciences, RSF | 589,2 billion Rubles for the state program of education, 2025; 3,2 billion on 200 New laboratories, 2024 | >1 600 Schools and >1 Millions of places for 2019–2024; 940 Youth Laboratories | Personnel, knowledge, optionality [RU06, RU07] |
| Industry and trade: Ministry of Industry and Trade, FRP, Rosstandart, REC | Section "National Economy" 4,8 trillion rub., 2026, Wider than industry | Manufacturing industries +8,5% in 2024; SME export contracts 139 billion rub. | Agency, technological sovereignty [RU08] |
| Energy: Ministry of Energy, Rosatom, SB UES, Rostechnadzor | Departmental estimates do not reflect the turnover of energy companies | 253,535 GW of power at the beginning 2024; ≈1 198 TWT·the C Generation 2024 | Continuity and basic cost [RU09] |
| Transport: Ministry of Transport, Rosavtodor, Russian Railways, Avtodor | 1,874 trillion rub. cash performance, 0,93% GDP, 2024 | 539 km of roads; 1 285 million railway passengers; quality index 105,4 with plan 105,7 | Connectivity and Time [RU10] |
| AIC: Ministry of Agriculture, Rosselkhoznadzor, Rosrybolovstvo | 682 billion Rubles for four state programs, 0,34% GDP, 2024 | Grain 125,9 mln t | Food, territories, reproduction [RU11] |
| Health and demography: Ministry of Health, FOMS, Ministry of Labour, SFR | FOMC expenditure ≈4,7 trillion rub. = 2,0% Projected GDP, 2026 | 1 222 408 Births in 2024; Medical budget does not explain demography one | Healthy Life Years and Family Trust [RU12] |
| Defense and security: Ministry of Defense, Ministry of Internal Affairs, FSB, Rosgvardiya, Emergencies Ministry | 10,77 trillion = 5,32% GDP, 2024; ≈12,9 trillion = 5,49% GDP and 29,3% Federal Spending, 2026 | Maintenance of combat readiness and security; civilian conversion is measured separately | Border and Survival [RU13] |
| Ecology: Ministry of Natural Resources, Rosprirodnadzor, REO | 477,5 billion rub. = 0,236% GDP, 2024; 522,7 billion = 0,222%, 2026 | Processing of MSW 54,8%; Disposal and Disposal 13,7% | The suitability of the territory for life [RU14] |
| Digital circuit: Minzifra, Roskomnadzor, GoTech | There is no single comparable unit | Possibility of broadband access in 93,7% households; actual Internet 88,5%, 2024 | Observing and reducing transaction costs [RU15] |
The sums of different lines have different perimeters. They serve as control points and do not form an additive departmental estimate.
| The contour of security dominates over direct civil development: the defense of 2026 is about 2,7 times larger than the entire section "National Economy". Scientific risk is the break "study → prototype → purchase → series". |
|---|
China: Balance on functional contours
The reference year is 2025. The total public budget does not include the entire quasi-fiscal, banking, corporate and local investment contour.
| Function and institutions | Resource / budget | Measurable output | The Meaningful Exit |
|---|---|---|---|
| Finance: MoF, PBOC, NDRC, STA, GACC, NBS | 28,7395 trillion RMB General Public Budget = 20,50% GDP, 2025 | GDP 140,1879 trillion RMB; budget, credit and output are separate | Trust in calculations and strategic coordination [CN01, CN03] |
| Science and education: MOST, MOE, CAS, NSFC | Education 4,3417 trillion; Public Science and Technology 1,2062 trillion RMB | Aggregate R & D 3,9262 trillion = 2,80% GDP; fundamentals 0,2778 trillion | Optionality and technological update [CN01, CN03, CN05] |
| Industry and Trade: MIIT, MOFCOM, SAMR, NDRC | The departmental line is not equal to the industry issue | Industrial value added 41,6826 trillion; high-tech manufacturing +9,4%; commodity trade 45,4685 trillion | Production Agency and Scale [CN01] |
| Power: NEA, NDRC, SASAC, State Grid | Corporate and tariff flows more budget | 10 575 TWT·H generation; 3,891 TWh power; wind+Sun 1,842 TWT = 47,3% Power | Continuity and transition to net power [CN01] |
| Transport: MOT, CAAC, NRA, China Railway | 1,1977 trillion RMB budget expenditures = 0,85% GDP | 59,67 billion tons of cargo; 27,412 trillion t·km; ports 354,47 million TEU; 199 billion Express Shipped | Market connectivity, speed and density [CN01, CN03] |
| APK: MARA, NFGA, SAMR | 2,3495 trillion RMB for Agriculture, Forests and Water = 1,68% GDP | Grain 714,88 mln t | Food and territorial reproduction [CN01, CN03] |
| Health and social protection: NHC, NHSA, MHRSS, MCA | Health 2,1446 trillion; Employment and Social Protection 4,4416 trillion RMB | Insurance covers 1,33068 billion person = 94,7%; population −3,39 million, 2025 | Viability and demographic contract [CN01, CN03] |
| Defence: CMC, MND, the Military - Industrial Outline | 1,784665 trillion RMB = 1,27% GDP, 2025 | Maintenance of defense readiness; civilian spillover is not expected automatically | Sovereignty and Security [CN04] |
| Ecology: MEE, NDRC, NEA, NFGA | 581,6 billion RMB = 0,415% GDP | Carbon intensity −5%; share of good air 72,6%; Class I water–III 91,4% | Intergenerational fitness of the environment [CN01, CN03] |
| Number and data: CAC, MIIT, NBS, SAMR | Divided between state and corporations | Info/Software/IT services 7,0599 trillion RMB = 5,04% GDP; Internet 80,1%; e-commerce 46,7339 trillion | Synchronization, memory and scaling [CN01] |
The sums of different lines have different perimeters. They serve as control points and do not form an additive departmental estimate.
| CHINA DIAGNOSIS Human Block - Education, Health, Employment and Social Protection — 10,9279 trillion RMB: 38,0% the General Public Budget and 7,8% GDP. Aggregate R & D 3,26 The State Budget is only one of the channels of knowledge. |
|---|
United States: balance by functional contours
All amounts are outlays, not budget authority. FY2024/25 is a fact, FY2026 is an estimate. Diagnosis: budget primarily insures and redistributes; interest is already comparable to defense, and 79,4% federal conduct of R&D is concentrated in defense and health.
| Function and institutions | Resource / budget | Measurable output | The Meaningful Exit |
|---|---|---|---|
| Finance: Treasury, Fed, IRS, OMB; measurement BEA/Census/BLS/ | Treasury 1 316,9 / 1 458,9 / 1 522,7 billion $ in FY2024/25/26; Net interest 879,9 / 970,1 / 1 016,7 | Deficit FY2024 1 815,4 billion $; Fed Balance 7,08 trillion $ in September 2024 | The price of time, solvency and observability [US01, US04] |
| Science and education: NSF, NIH, NASA, DOE Science, DARPA | Federal conduct of R&D 186,9 / 192,7 / 175,4 billion $ | FY2024: defense R&D 99,0; medical 49,4; NASA 11,4; DOE 10,5; NSF 6,9 billion $ | Optionality and specialized competences [US01] |
| Industry and Commerce: Commerce, NIST, BIS, USTR, SBA, EXIM | Commerce 14,8 / 29,7 / 21,2 billion $; There is no single additive budget | Standards, patents, export controls; trade deficit in goods and services 903,5 billion $, 2024 | Autonomy without autarky and market access [US01] |
| Power: DOE, EIA, FERC, NRC, DOI | DOE 49,3 / 52,3 / 59,6 billion $; Functionally 13,6 / 20,8 / 27,9 | Primary energy 103,3 quadrillion Btu, record 2024 | Power and Stability [US01, US05] |
| Transport: DOT, FHWA, FAA, FRA, FTA, MARAD | DOT 117,4 / 127,6 / 131,5 billion $; Functionally 136,6 / 145,3 / 150,3 | 3,294 trillion vehicle-miles in 2024 | Connection and speed [US01, US06] |
| APK and food: USDA, ERS, NASS, ARS, FNS, FSIS | USDA 203,4 / 227,5 / 238,8 billion $ | Farm cash receipts 513,5 billion $; Agricultural exports 176,0 billion $, 2024 | Food and reproduction [US01] |
| Health and demographics: HHS, CMS, CDC, FDA, NIH, SSA | HHS 1 720,6 / 1 884,3 / 2 036,0 billion $ | National health expenditure 5,3 trillion $ = 18,0% GDP; life expectancy 79,0 years | Longevity and human capital [US01, US07] |
| Safety and Security: DoD, DHS, DOJ, FEMA, IC | DoD 826,3 / 868,4 / 913,7; DHS 89,3 / 115,3 / 116,3; Defense function 873,5 / 916,1 / 966,4 billion $ | National defense = 3,0% GDP, FY2024 | Sovereignty and Continuity [US01] |
| Ecology: EPA, NOAA, DOE, DOI/USGS, FEMA | EPA 13,7 / 37,0 / 22,3; function resources/environment 58,5 / 89,8 / 78,1 billion $ | Latest inventory: 6 343 million tons CO₂e gross, 2022; Net on 17% below 2005 | Common good and intergenerational boundary [US08] |
| Figure and data: OMB CIO/OIRA, GSA/TTS, CISA, NIST, NTIA | IT Plan FY2024 ≈95,0 billion $; dashboard FY2025 102,31 billion $ | ≈74 billion the Legacy Operations and 21 billion the Development / Modernization FY2024 | Coherence and Memory of the State [US09] |
The sums of different lines have different perimeters. They serve as control points and do not form an additive departmental estimate.
Intersectoral balance: statistical basis
The last year of the current comparable OECD ICIO — 2022. National tables of Russia, China and the United States are used to detail and control the structure; current departmental indicators 2024–2026 are connected as satellite accounts, rather than replacing the basic matrix.
| Source | Coverage | Role |
|---|---|---|
| OECD ICIO 2025 edition | 80 Economics + Rest of World; 1995–2022; Editorial Board January 2026 | Total three-country 30×30 Model [M01] |
| Russia | Rosstat base tables for 2021 and 2016 | Internal Structure Control [RU01, RU02] |
| China | NBS Yearbook 2025: competitive and non-competitive tables for 2023, 20×20 Products | Separation of domestic and imported products [CN02] |
| USA | BEA Supply, Use, Import and Requirements tables | Detailing Industries and Full Needs [US02, US03] |
A single bridge to ISIC Rev.4 is used to aggregate the source industries. Cash flows are in base prices and current dollars. PPP cannot be inserted into the transaction matrix: it will destroy the coherence of trade flows.
| Three countries × 10 SECTORS Diagonal blocks Zᴿᴿ, Zᶜᶜ, Zᵁᵁ — domestic supply; non-diagonal supply between powers. Rest of World remains an external account, otherwise the import of third countries will mistakenly become the value added of the three. |
|---|
Ten comparable sectors
| № | Sector | ISIC Rev.4 | Main functional owners |
|---|---|---|---|
| 1 | APC and food | A, C10–12 | Ministry of Agriculture / MARA / USDA |
| 2 | Production, fuel, oil refining | B, C19 | Ministry of Energy, Ministry of Natural Resources / NEA / DOE, DOI |
| 3 | Electricity and utility systems | D–E | Energy, housing, ecology |
| 4 | Chemistry, pharmaceuticals, metals, materials | C20–24 | Industry, Health, Defense |
| 5 | Machinery, electronics, transport equipment | C25–30 | Industry, science, transport, defense |
| 6 | Other manufacturing industry | C13–18, C31–33 | Industry and trade |
| 7 | Construction and infrastructure | F | Construction, transport, energy |
| 8 | Trade, transport and logistics | G–I | Trade and transport |
| 9 | ICT, finance, real estate, business services | J–N | Finance, digital sphere, regulators |
| 10 | State, science, education, health, culture | O–T | Public and social institutions |
Basic formulas
| Node | Formula | Interpretation |
|---|---|---|
| Output Balance | xᵢ = Σⱼzᵢⱼ + yᵢ; xⱼ = Σᵢzᵢⱼ + vⱼ | Output equals intermediate sales plus final demand; costs equal intermediate inputs plus value added |
| Direct coefficients | A = Z · x̂⁻¹ | How many row products are directly required per column output unit |
| Reverse Matrix | L = (I − A)⁻¹; Δx = LΔy | Full direct and indirect output from changes in final demand |
| Departmental bridge | ΔVAᵐⁱⁿ = G · q̂ · Δx | G distributes primary responsibility, q translates output into value added or result |
| Knowledge | A* = A + θK | K - satellite matrix of knowledge transfer; θ - confirmed speed of implementation |
| Use | Benefit = qᵀ(xsync − xbase) + ΔExpectedLoss − Ccoord | Considered as value added and preventable damage, not as gross output |
| SUSTAINABLE CONDITION The spectral radius of the author's matrix A is equal to 0,528 < 1. Therefore, the inverse matrix of Leontiev exists, and the solution converges. |
|---|
Author's normalized balance: 100 units of issue
| Sector | Release | Intermediate sales | Final demand | In between costs | Value added |
|---|---|---|---|---|---|
| APC and food | 5.0 | 3.3 | 1.7 | 2.5 | 2.5 |
| Production, fuel, oil refining | 12.0 | 8.5 | 3.5 | 5.5 | 6.5 |
| Electricity and utility systems | 4.0 | 3.5 | 0.5 | 2.0 | 2.0 |
| Chemistry, pharmaceuticals, metals, materials | 11.0 | 7.4 | 3.6 | 7.2 | 3.8 |
| Machinery, electronics, transport equipment | 15.0 | 8.5 | 6.5 | 10.0 | 5.0 |
| Other manufacturing industry | 7.0 | 3.2 | 3.8 | 4.3 | 2.7 |
| Construction and infrastructure | 9.0 | 3.1 | 5.9 | 5.3 | 3.7 |
| Trade, transport and logistics | 14.0 | 5.4 | 8.6 | 7.0 | 7.0 |
| ICT, finance, real estate, business services | 14.0 | 6.1 | 7.9 | 5.0 | 9.0 |
| State, science, education, health | 9.0 | 2.5 | 6.5 | 2.7 | 6.3 |
| Total | 100,0 | 51,5 | 48,5 | 51,5 | 48,5 |
Author’s internally agreed billet, not official statistics of Russia, China or the United States.
| 51,5% intermediate intensity from release | 48,5% value added from issue | 2,06 weighted multiplier gross output | 0,528 spectral radius stable system |
|---|
Matrix of direct dependencies
Figure 3. Value — product units of a row for 100 units of column output. The sector numbers correspond to the previous table.
| Supplier ↓ / User → | 1 | 2 | 3 | 4 | 5 | 6 | 7 | 8 | 9 | 10 |
|---|---|---|---|---|---|---|---|---|---|---|
| 1. APK | 5.1 | 0.4 | 0.4 | 2.4 | 1.1 | 21.8 | 0.7 | 5.1 | 0.6 | 1.8 |
| 2. Extraction | 3.8 | 7.4 | 27.7 | 22.6 | 7.0 | 3.4 | 8.2 | 10.7 | 1.6 | 0.9 |
| 3. Energy | 3.6 | 5.2 | 2.6 | 5.3 | 4.9 | 2.4 | 2.9 | 3.0 | 2.0 | 1.6 |
| 4. Materials | 7.3 | 7.5 | 3.8 | 9.3 | 17.2 | 6.7 | 13.5 | 3.5 | 1.0 | 0.7 |
| 5. Machines | 5.9 | 8.6 | 4.3 | 7.0 | 13.0 | 6.3 | 11.5 | 10.0 | 7.4 | 4.2 |
| 6. Other prom. | 6.1 | 2.2 | 1.1 | 1.8 | 3.3 | 6.5 | 3.0 | 2.6 | 3.3 | 3.8 |
| 7. It does. | 1.7 | 2.4 | 2.4 | 2.0 | 2.7 | 1.8 | 5.4 | 2.8 | 4.2 | 4.7 |
| 8. Logistics | 9.3 | 5.4 | 3.4 | 6.6 | 7.6 | 6.0 | 6.0 | 4.7 | 3.2 | 2.3 |
| 9. ICT/services | 5.8 | 5.8 | 3.4 | 6.8 | 7.6 | 5.0 | 6.0 | 5.8 | 7.2 | 4.1 |
| 10. Goss/soc. | 1.4 | 1.0 | 1.0 | 1.6 | 2.3 | 1.5 | 1.8 | 1.7 | 5.2 | 5.8 |
Author's matrix A; percentages from the output of the consumer industry.
Critical Direct Links: Mining → Energy 27,7; mining → materials 22,6; APK → Other food and consumer industries 21,8; materials → Machines 17,2; materials → Construction 13,5; Machines → own issue 13,0.
Multipliers and bottlenecks
Figure 4. The power of the physical chain and the criticality of the information layer differ.
| Sector | μ | BL | FL | Excess | Narrow place | Reproduction |
|---|---|---|---|---|---|---|
| APK | 2.07 | 0.99 | 0.83 | 95% | 7 | 108 |
| Mining and fuel | 1.98 | 0.95 | 1.44 | 97% | 12 | 115 |
| Energy and housing | 2.03 | 0.97 | 0.84 | 97% | 6 | 120 |
| Materials and Chemistry | 2.36 | 1.13 | 1.23 | 89% | 31 | 112 |
| Machines and electronics | 2.45 | 1.17 | 1.29 | 85% | 55 | 125 |
| Other industry | 2.31 | 1.10 | 0.80 | 67% | 29 | 105 |
| Construction | 2.28 | 1.09 | 0.77 | 91% | 12 | 110 |
| Trade and logistics | 2.06 | 0.99 | 1.04 | 92% | 17 | 115 |
| ICT and business services | 1.74 | 0.83 | 1.07 | 67% | 100 | 130 |
| State and Social Sphere | 1.62 | 0.77 | 0.70 | 95% | 8 | 118 |
All indicators are derivatives of the author's matrix; 100 in reproduction means a simple replacement of wear.
| The investment only in the "biggest multiplier" is insufficient. Machines and materials create a physical wave, but ICT, finance, standards, metrology and interoperable data determine whether the wave will turn into a sustainable chain. |
|---|
How Ministries Are Overlaid on Industries
| Function | Major sectors | Channel of influence | Monitoring |
|---|---|---|---|
| Finance and macro-management | 9 ICT/Finance/Services; 10 | Rate, Taxes, Customs, Statistics, Guarantees | Do not ascribe all Treasury or Treasury sector 9 |
| Science and education | 5 machines; 9 ICT; 10 state/social sphere | Grants, personnel, laboratories, standards, procurement | Knowledge is taken into account through K and confirmed implementation |
| Industry and trade | 4–6 materials and manufacturing; 8 trade | Subsidies, credit, standards, export access | Main effect: change of coefficients A and import share |
| Energy | 2 mining; 3 energy; 4 materials; 7 infrastructure | Tariff, power, reserve, network modernization | Energy is included in almost all columns A |
| Transport | 5 machinery; 7 infrastructure; 8 logistics; 9 data | Capturing, security, capacity | KPI - time, reliability and cost, not just km |
| APK and food | 1 APK; 4 Chemistry; 5 Engineering; 8 Logistics | Production, insurance, sanitation, food | USDA/HHS-like transfers separate from issue |
| Health and demographics | 4 pharma; 5 medical equipment; 10 social sphere | Insurance, prevention, treatment, family | The result is interdepartmental: housing, income, education |
| Defence and security | 4–5 manufacturing; 9 ICT; 10 state | Readiness, reserves, cyber defense, emergency situations | Civil Spillover requires separate verification |
| Ecology | All 1–10 through emissions and resources | Standards, monitoring, recovery, recycling | Separate environmental satellite account |
| Figure and data | 9 ICT; horizontally 1–10 | Registries, identifiers, API, cyber resistance | Anti-double-count: the effect is distributed according to the results of other blocks |
| The sum of the primary responsibility weights for each sector is 1. Consultative participation is conducted by a separate matrix, otherwise the same result will be attributed to several departments. |
|---|
Getting Out Through Meanings: Eight Public Capabilities
| Meaning | Operational Definition | Examples KPI |
|---|---|---|
| Sovereignty | Maintaining critical functions under external constraints | Import dependency; internal critical value added; savings; concentration of suppliers |
| Reproduction | Reproduction of population, health, work, skills and capital | Life expectancy and healthy years; fertility; employment; capital renewal |
| Optionality | Realistically available technological, production and logistics alternatives | R&D/GDP; high-tech export; alternative suppliers; patents/standards; Internet |
| Resilience | Shock absorption and restoration of function in a given time | RTO/MTTR; reserve; energy independence; stress tests; efficiency |
| Trust / Legitimacy | Predictability of rules, fairness of procedures and proven quality of services | Rule of Law; enforcement control; enforcement of decisions; complaints; quality of services |
| Development | Expanding productive human and economic opportunities | GDP per capita at PPP; productivity; employment; R & D; education and health |
| Security | Protection of life, infrastructure and institutions | Murders; political stability; stress test of critical objects; accidents |
| Public goods | Positive effect wider than the direct payer | CO₂e; clean energy; open knowledge and data; epidemiological and climate protection |
| Costs are not automatically considered as a result. The department receives a contribution to the semantic output only when the independent KPI is changed. |
|---|
Normative map of functions to meanings
| Functional block | Souv. | Resp. | Opts. | Word of mouth. | Dover. | Razv. | Bezop. | Common. |
|---|---|---|---|---|---|---|---|---|
| Strategy and management | 25 | 0 | 10 | 10 | 25 | 5 | 15 | 10 |
| Finance, Taxes, Customs | 25 | 5 | 20 | 15 | 10 | 20 | 5 | 0 |
| Industry, trade, food | 20 | 15 | 15 | 15 | 5 | 20 | 5 | 5 |
| Energy, transport, communication, number | 15 | 10 | 15 | 20 | 5 | 20 | 10 | 5 |
| Science and education | 5 | 15 | 30 | 10 | 10 | 20 | 0 | 10 |
| Health, work, housing | 0 | 35 | 10 | 20 | 20 | 10 | 0 | 5 |
| Defense, Right, CS | 15 | 5 | 5 | 15 | 15 | 0 | 40 | 5 |
| Ecology and external benefits | 5 | 5 | 10 | 20 | 15 | 5 | 5 | 35 |
Interest is the author's starting matrix. Each line is summed up to 100%; weights must be fixed before the beginning of the budget period.
Academies of Sciences belong primarily to the Science and Education block, but their final results go into optionality, development, safety, and public goods. Publication itself is a release; proven technology, an open standard, or risk reduction is a meaningful exit.
Demonstration model 0–100
Figure 5. A profile of opportunities, not a moral hierarchy or official ranking.
| Country | Souv. | Resp. | Opts. | Word of mouth. | Dover. | Razv. | Bezop. | Common. | Medium |
|---|---|---|---|---|---|---|---|---|---|
| Russia | 74.3 | 47.9 | 33.1 | 54.9 | 33.4 | 36.7 | 41.2 | 27.5 | 43.6 |
| China | 80.6 | 48.6 | 73.5 | 56.9 | 42.1 | 38.2 | 78.6 | 47.6 | 58.3 |
| USA | 52.4 | 65.1 | 82.4 | 68.8 | 72.1 | 83.5 | 57.1 | 43.9 | 65.7 |
Official source WDI/WGI; weights, anchors and summary scores are author's. The years of the initial series differ (2020–2024).
| Country | Strength of the model | Narrowness of model | What is not included |
|---|---|---|---|
| Russia | Resource autonomy and savings | Optionality, common goods, institutional external proxies | Not included strategic weapons and rare mineral reserves |
| China | Industrial and resource sovereignty, security, technological option | Demographics and per capita income | External institutional proxies are not equal to internal approval |
| USA | Development, R&D, institutional proxies | Savings, industrial share, carbon contour | The dollar’s financial role is not included |
| STRATEGY FOR THE NUMBER PLACE Equilibrium Index: 0,7 × geometric average + 0,3 × minimum. Result: Russia 37,4; China 50,7; USA 58,2. This is a diagnostic scenario, not a second rating. |
|---|
The benefits of synchronizing the three powers
Figure 6. Central scenario: average index 55,9 → 60,0.
| Meaning | Average base | Best practices | 25% Gap | After |
|---|---|---|---|---|
| Sovereignty | 69,1 | 80,6 | +2,9 | 71,9 |
| Reproduction | 53,8 | 65,1 | +2,8 | 56,7 |
| Optionality | 63,0 | 82,4 | +4,9 | 67,9 |
| Resilience | 60,2 | 68,8 | +2,1 | 62,4 |
| Trust / Legitimacy | 49,2 | 72,1 | +5,7 | 54,9 |
| Development | 52,8 | 83,5 | +7,7 | 60,5 |
| Security | 59,0 | 78,6 | +4,9 | 63,9 |
| Public goods | 39,7 | 47,6 | +2,0 | 41,6 |
| +1,7 p.p. closed 10% Breakdown Low Scenario | +4,1 p.p. closed 25% the Central Gap | +6,6 p.p. closed 40% Gap High | 4,1 p.p. break-even cost threshold |
|---|
Sensitivity and Limitations of Meaning Index
| Weight system | Russia | China | USA |
|---|---|---|---|
| Equal weight: 12,5% each meaning | 43,6 | 58,3 | 65,7 |
| Sovereignty/security: by 20%; sustainability 15% | 47,8 | 63,0 | 64,7 |
| Human/Development: Reproduction and Development by 20% | 43,0 | 53,5 | 68,1 |
| Sustainable future: common goods 20%; optionality and sustainability according to 15% | 42,0 | 57,9 | 64,5 |
| Range at ×0,5/×2 The weight of meaning | 41,6–47,0 | 56,0–60,7 | 63,2–67,6 |
- WGI - perception-based external proxies; they do not measure public approval and do not exhaust legitimacy.
- The years of the original WDI are different: murders, renewable electricity, and manufacturing share have a lag.
- Thresholds are a normative choice. Anchors and weights should be approved in advance and published together with the result.
- One strong indicator should not fully compensate for failure: therefore, in addition to the average, a minimum and a geometric index are published.
- Causality is not attributed without a control group, a temporal break, an instrument, or assessed elasticity.
Passport of the project
| Field | Question | Minimum standard |
|---|---|---|
| Issue addressed | What is the risk or deficit without a project? | Baseline and counterfactual scenario |
| Fiscal entrance | Who and how much is paying? | Currency, year, budget perimeter |
| Financial risk | What guarantees, assets and liabilities arise? | Term, bet, probability of loss |
| Industry momentum | What elements Δy and A are changing? | Sector, import share, suppliers |
| Departmental owner | Who is responsible for the main result? | One primary owner; co-executors separately |
| Physical Release | What is created or delivered? | t, km, MW, operations, trained people |
| Outcome | What really got better? | Time, price, quality, availability, reliability |
| Meaning | What social ability enhances outcome? | One primary and up to two secondary meanings |
| External effect | What is being transferred to other industries, countries or generations? | CO₂e, health, import, risk |
| Additionality | What would have happened without coordination? | Comparison with offline scenario |
| Verifier | Who confirms KPI regardless of the owner? | Statistics, audit, academic replication |
| Stop rule | When does the project change or stop? | Threshold, correction period, reversible exit |
| ANTI-DOUBLE-COUNT One KPI has one primary owner, but may have multiple co-owners. Economic effect, prevented damage and semantic output are published separately. |
|---|
The First Pilots' Portfolio
| Pilot | Participants | Product | KPI |
|---|---|---|---|
| Compatible supply-use / input-output tables | Statistical Services, OECD/UN, academies | Uniform product codes, import, value added, carbon | 30×30 The matrix is reproduced by an independent team |
| Reliability of power grids | Energy regulators, system operators, laboratories | Stress test protocol and exchange of impersonal parameters | Reduction of RTO and emergency non-holiday |
| Methane and Industrial Ecology | Environmental agencies, space and scientific organizations | Satellite verification and single coefficients | Tons of confirmed prevented CO₂e |
| Epidemiological Early Warning | Sanitary departments, CDC-like services, academies | Samples, metadata, spare capacity | Time from signal to confirmation and response |
| Critical Logistics | Transport, Customs, Ports, Standardization | Compatible documents and emergency routes | Time and cost of restoration of supply |
| Open scientific standards | RAS, CAS, National Academies, NIST/Rosstandart/SAMR | Reference materials, metrology, replication | Number of reproducible methods and standards |
Pilot architecture: limited perimeter → common base line → independent verification → 12–18 months → The decision to scale/modify/stop. Political unification, a single budget and critical monodependency are not required.
Conclusions
| 01 Ministries are not industries. They change the final demand, rules, cost of capital, standards, infrastructure, and the ability of industries to interact. |
|---|
| 02 The budget balance without credit, physical, inter-industry and semantic layers systematically overestimates the development of funds and underestimates the horizontal effects. |
|---|
| 03 Russia: the largest direct federal priority is security; the main civil issue is the conversion of knowledge and heavy competencies into serial demand. |
|---|
| 04 China: The state budget is combined with large banking, regional and corporate flows; the main structural challenge is demographic and domestic reproduction. |
|---|
| 05: Federal outlays are dominated by social insurance, health care, and interest; a small budget of standard or statistics can affect trillions of dollars. |
|---|
| 06 Machines, materials, and construction are prioritized in the physical balance; in the system, data, finance, software, metrology, and standards. |
|---|
| 07 Academies of Sciences are useful not by the number of publications, but by the speed of the testable transition → Standard/Technology → implementation → Reduction of cost or risk”. |
|---|
| 08 A semantic account makes one answer what the ability of a society creates a program, and does not allow one to call the expense the result. |
|---|
| 09 The central synchronization scenario gives +4,1 points of the sense index; it is beneficial while the average coordination losses are lower 4,1 Paragraphs. |
|---|
| 10 Working synchronization is modular, verifiable, reversible and open to third parties under the same rules. Its core is compatible data and independent verification. |
|---|
Annex A. Baseline indicators of the semantic model
| Indicator | Russia | China | USA |
|---|---|---|---|
| Gross Savings, % of GDP (2024) | 30,84 | 42,72 | 16,60 |
| Net energy imports, % energy use | −75,14 (2022) | 23,96 (2023) | −9,00 (2023) |
| Manufacturing VA, % of GDP | 13,26 (2024) | 24,84 (2024) | 10,53 (2021) |
| Life expectancy, years (2024) | 73,44 | 78,02 | 78,89 |
| Fertility (2024) | 1,418 | 1,013 | 1,6265 |
| Employment / population, % (2024) | 60,32 | 61,93 | 59,47 |
| R&D / GDP | 0,94 (2024) | 2,58 (2023) | 3,45 (2023) |
| High-tech exports, % manufactured exports | 9,73 (2021) | 26,28 (2024) | 24,32 (2024) |
| Internet users, % (2024) | 94,36 | 92,00 | 94,69 |
| Renewable electricity, % (2021) | 19,15 | 28,43 | 20,27 |
| GDP per capita PPP, const. intl$ (2024) | 41 891 | 23 841 | 75 698 |
| Intentional homicides per 100k | 6,77 (2021) | 0,50 (2020) | 5,76 (2023) |
| CO₂e per capita, t (2024) | 13,98 | 9,32 | 13,62 |
| Scientific articles per million (2023) | 594,9 | 661,2 | 1 279,4 |
| WGI Government Effectiveness (2024) | 45,1 | 68,8 | 77,8 |
| WGI Rule of Law (2024) | 37,1 | 47,0 | 73,5 |
| WGI Control of Corruption (2024) | 29,8 | 49,6 | 69,9 |
| WGI Voice & Accountability (2024) | 32,0 | 27,9 | 72,4 |
| WGI Political Stability (2024) | 50,5 | 63,3 | 64,3 |
Sources: World Development Indicators and Worldwide Governance Indicators. Values are rounded; years are shown in rows.
Annex B. Formulas of sense account
| Indicator | Formula |
|---|---|
| Internal block value added | Xc,b = vc′ · Lc · fc,b |
| Attribution Flow | Cc,b,m = Xc,b · pc,b · gb,m; Σm gb,m = 1 |
| Smyslovay KPI | Sc,m = Σj ωm,j · Nm,j(xc,j); Σj ωm,j = 1 |
| Positive rationing | N⁺(x) = 100 · clip((x−L)/(U−L), 0, 1) |
| Reverse rationing | N⁻(x) = 100 · clip((U−x)/(U−L), 0, 1) |
| Causal contribution with known elasticity | ΔŜc,m = Σb gb,m · εm,b · Δln Xc,b |
| Synchronization | Tm(ρ) = S̄m + ρ(maxc Sc,m − S̄m) − dm |
| Equilibrium Index | Ec = 0,7 · exp(Σm βm ln(Sc,m+ε)) + 0,3 · minm Sc,m |
Attribution is not a monetary measure of well-being and does not add up to GDP.
Annex C. Sources
Primary and methodological sources. Date of access: 27 August 2026.
[M01] OECD Inter-Country Input-Output Tables, edition 2025
[M02] OECD harmonised national Input-Output Tables
[RU01] Rosstat: National Accounts and Cost-Output Tables
[RU02] Rosstat: basic tables "costs-release" for 2021 year
[RU03] Rosstat: Revised GDP estimate 2024
[RU04] Ministry of Finance of Russia: preliminary execution of the federal budget for 2024
[RU05] Government of Russia: federal budget 2026–2028
[RU06] Ministry of Education of Russia: expenses of the state program "Development of Education"
[RU07] Ministry of Education and Science of Russia: Youth Laboratories
[RU08] Ministry of Industry and Trade of Russia: results of the manufacturing industry 2024
[RU09] Ministry of Energy of Russia: scheme and program for the development of electric power systems
[RU10] Ministry of Transport of Russia: report on results 2024
[RU11] Ministry of Agriculture of Russia: results and priorities of agro-industrial complex 2024
[RU12] Budget Act of the Federal Migration Service for 2026
[RU13] State Duma: budget section "National Defense" 2026
[RU14] The State Duma: expenditures on environmental protection
[RU15] Ministry of Finance of Russia: national project "Data Economy"
[CN01] NBS China: Statistical Communiqué 2025
[CN02] NBS China Statistical Yearbook 2025: Input-Output Tables
[CN03] Ministry of Finance China: budget execution 2025
[CN04] State Council of the People's Republic of China: defense budget 2025
[CN05] Chinese Academy of Sciences: official profile
[US01] OMB: Historical Tables, Budget of the U.S. Government
[US02] BEA: Input-Output Accounts Data
[US03] BEA: Interactive Input-Output Accounts
[US04] Federal Reserve: Monetary Policy Report, July 2026
[US05] EIA: U.S. energy production reached record high in 2024
[US06] FHWA: Highway Statistics 2024
[US07] CMS: National Health Expenditure Fact Sheet
[US08] EPA: Inventory of U.S. Greenhouse Gas Emissions and Sinks
[US09] GAO: Federal IT spending and legacy systems, FY2024
[WB01] World Bank: World Development Indicators
[WB02] World Bank: Worldwide Governance Indicators
[UN01] UN Statistics: handbook on Supply-Use and Input-Output Tables
Annex D. Terms
| Term | Definition |
|---|---|
| Supply-Use Table | Table of resources and use: production, import and use of products by industries and end users. |
| Input-Output Table | A symmetric table of cross-industry supply, value added and final demand. |
| Release multiplier | The total gross output arising in all industries per unit of final demand; contains a re-account of intermediate products. |
| Value added | Issuance minus intermediate consumption; correct basis for aggregation of economic result. |
| BL / FL | Standardized backward and forward system connectivity of the industry. |
| Hypothetical extraction | Comparison of the system with the industry and without it to assess system criticality. |
| Satellite account | Expanding national accounts for ecology, health, knowledge or other outcomes without mixing units. |
| The Meaningful Exit | Observed social capacity arising from the passage of resources through institutions and industries. |
| Additionality | Part of the result that would not have occurred without the project or coordination. |
| Break-even Coordination | The maximum average loss from agreement, in which the net semantic effect is still non-negative. |
End of document
Source materials
Originals and versions of the document
- Ministerstva_Uchrezhdeniya_Mezhotraslevoi_Balans_Smysly_2026.docxDOCX · main document
- Ministerstva_Uchrezhdeniya_Mezhotraslevoi_Balans_Smysly_2026.pptxPPTX · related version
Other editions in web format
Each version is disclosed separately; the sequence of the source document is saved.
From Budget to MeaningMinisterstva_Uchrezhdeniya_Mezhotraslevoi_Balans_Smysly_2026.pptx · web text+
30 × 30
BOOK OF BALANCE
the Ministry • Institutions •
3 Countries × 10 Sectors
Russia • China • USA
Functional slice 2024–2026
Structural base OECD ICIO 2022
MEANS OF EXITS
27 August 2026
Systemic balance is more important than budget
SUMMARY FOR DECISIONS
30 × 30
2,06
55,9 → 60,0
4,1 p.p.
Model Core
Multiplier
sense index
break-even
three countries × ten sectors
Author's balance 100 units
25% Closing the gap
coordination loss threshold
The unit of analysis is the chain "Institute → industry → result → public sense", not the departmental line of expenditure.
Machines and materials spread the physical impulse.
Data, finance, software and standards hold the system.
The budget does not become a result without an independent KPI.
Benefits are considered as value added and preventable losses.
Ministries consider entrances - society evaluates exits
TRANSFORMATION LOGIC
RESOURCE
INSTITUTE
INDUSTRY
RESULT
MEANING
Budget • credit
labor • import
Program • Rule
purchase • standard
Direct and indirect
Issue • import
Price • time
Quality • Access
Ability of society
Prevented risk
Expenses are not automatically counted as a result: a contribution arises only when you change the independent output-KPI.
Five Balances instead of one
ARCHITECTURE STUDY
Appropriation • Taxes • Purchases
Perimeter and Year
Fiscal entrance
credit • guarantees • assets • liabilities
Stock ≠ stream
Financial balance
Z • A • L • Import • Value Added
without double counting
Intersectoral flow
MW • TWT·h • t • Kilomile • years of life • RTO
Quality and Access
Physical result
8 sustainable social abilities
Independent KPI
The Meaningful Exit
m = H · Q · (I − A)⁻¹ · G · b − r
METHOD
General formula of state effectiveness
budget impulse
Bridge to Industries
full chain
entrance
Responsibility
Direct +
Result factors
Map of meanings
risks and costs
outcome
Public ability
Deduction
Meaningful flow is an attribute, not a monetary measure of well-being. It cannot be added to GDP.
Three states run three different accounts
COMPATIBILITY
| Parameter | Russia | China | USA |
|---|---|---|---|
| Public Perimeter | Federal budget | General public budget | Federal outlays |
| Year | Calendar | Calendar | fiscal year |
| Control share of GDP | 19,9% (2024) | 20,5% (2025) | 23,3% (FY2024) |
| The main risk of reading | Defense ≠ all security | budget ≠ Loan/State Company | agency ≠ function; transfers |
| Structural IO-base | Rosstat 2021 + OECD 2022 | NBS 2023 + OECD 2022 | BEA + OECD 2022 |
GDP shares are acceptable as a macro signal, but not as a performance rating. National currencies and disparate budget lines are not summed up.
Ten Functions - Three Institutional Architectures
INSTITUTIONAL MAP
| Function | Russia | China | USA |
|---|---|---|---|
| Finance | Ministry of Finance • CB • FTS • Rosstat | MoF • PBOC • NBS • NDRC | Treasury • Fed • OMB • BEA |
| Science | Ministry of Education and Science • RAS • RSF | MOST • MOE • CAS • NSFC | NSF • NIH • NASA • DOE • DARPA |
| Industry | Minpromtorg • FP • REC | MIIT • MOFCOM • SAMR | Commerce • NIST • USTR • SBA |
| Energy | Ministry of Energy • Rosatom • SUE | NEA • NDRC • State Grid | DOE • EIA • FERC • NRC |
| Transport | Ministry of Transport • Russian Railways • Motor | MOT • CAAC • NRA | DOT • FHWA • FAA • FRA |
| APK | Ministry of Agriculture • Rosselkhoznadzor | MARA • NFGA • SAMR | USDA • ERS • NASS • ARS |
| Health | Ministry of Health • FOMS • Ministry of Labor | NHC • NHSA • MHRSS | HHS • CMS • CDC • NIH • SSA |
| Security | Ministry of Defense • Ministry of Internal Affairs • FSB • MES | CMC • MND • MPS • MEM | DoD • DHS • DOJ • FEMA • IC |
| Ecology | Ministry of Natural Resources • REO | MEE • NDRC • NFGA | EPA • NOAA • DOI • FEMA |
| Data | Mincifers • Roskomnadzor | CAC • MIIT • NBS | OMB CIO • GSA • CISA • NIST |
Russia: security is the main absorber of the federal flow
FACT • 2024–2026
40,192 trillion
10,77 trillion
4,8 trillion
0,94% GDP
Federal expenses
National Defense
National Economy
General R & D
19,9% GDP, 2024
5,32% GDP, 2024
plan 2026; wide section
WDI, 2024
ENERGY
TRANSPORTATION
APK
253,535 GW
1,874 trillion rub.
125,9 mln t
≈1 198 TWT·the C Generation 2024
539 km of roads • 1 285 Millions of passengers
Grain 2024 • 682 billion rub. by 4 Programmes
The defense of 2026 is about 2,7 times larger than the entire section "National Economy". Narrow place: science → prototype → purchase → series.
China: Human capital and industrial scale work together
FACT • 2025
28,7395 trillion
10,9279 trillion
3,9262 trillion
41,6826 trillion
the General Public Budget
Human Block
General R & D
VA Industrial
20,50% GDP
38,0% Budget • 7,8% GDP
2,80% GDP
29,73% GDP
ENERGY
LOGISTICS
DEMOGRAPHY
10 575 TWT·h
354,47 mln TEU
−3,39 million
3,891 TWt Power • Wind+Sun 47,3%
59,67 billion tons of cargo • 199 billion Express Shipped
7,92 Millions of births • 11,31 Millions of deaths
General R&D is 3,26 times the public line of science and technology: the budget is only one of the channels of knowledge.
US: the largest flows - health, finance and defense
FACT • FY2024
$6 735,3 billion
General Federal Outlays
23,3% GDP
$879,9 billion
Net interest
against defense $873,5 billion
67,5% federal expenditures - human resources; 4,9% - physical. Agency outlays cannot be read as an industry issue.
79,4% federal conduct of R&D — defense + health
Two different power circuits: knowledge and safety
FACT • DIFFERENT YEARS
R&D: 2024 / 2025 / 2023
Defense: 2024 / 2025 / 2024
Comparable share of GDP, but not institutional mechanisms: state science, corporate R&D and defense R&D have different channels of implementation.
Total structural point — OECD ICIO 2022
STATISTICAL FRAMEWORK
2021
2022
2023
2024–26
RUSSIA
GENERAL BASE
CHINA
SATELLITES
Rosstat: basic tables
Costs - Release
OECD ICIO: 80 Economics
+ Rest of World
NBS: competitive /
non-competitive IOT 20×20
Budgets, KPI, WDI/WGI
without matrix substitution
Rosstat: basic tables
Costs - Release
OECD ICIO: 80 Economics
+ Rest of World
NBS: competitive /
non-competitive IOT 20×20
Budgets, KPI, WDI/WGI
without matrix substitution
The national tables control the structure; RAS/GRAS brings the differences together while maintaining output, import, value added and final demand.
PPP is not inserted into the transaction matrix: it violates the consistency of trade flows.
V 100 Units of production only 48,5 — value added
AUTHOR MODEL
STRUCTURE OF ISSUE
DISTRIBUTION OF ISSUES
51,5
Interim Turnover
48,5
final demand
| Sector | Release | In between costs | Added value |
|---|---|---|---|
| APK | 5 | 2.5 | 2.5 |
| Extraction | 12 | 5.5 | 6.5 |
| Energy | 4 | 2 | 2 |
| Materials | 11 | 7.2 | 3.8 |
| Machines | 15 | 10 | 5 |
| Other prom. | 7 | 4.3 | 2.7 |
| Construction | 9 | 5.3 | 3.7 |
| Logistics | 14 | 7 | 7 |
| ICT/services | 14 | 5 | 9 |
| Goss/soc. | 9 | 2.7 | 6.3 |
The gross output multiplier 2,06 is not equal to the public benefit: intermediate products are considered several times.
Who Depends on Who
AUTHOR'S MATRIX A
supplier ↓
27,7
21.8
Mining → Energy
27.7
22.6
10.7
The largest direct connection
17.2
13.5
22,6
11.5
mining → materials
Raw Material Channel
21,8
APK → other prom.
Food Contour
The production units of a row on the 100 output column.
consumer →
Machines and materials give the greatest physical impulse
AUTHOR MODEL
| Leader | μ | What strengthens | Risk |
|---|---|---|---|
| Machines and electronics | 2,45 | equipment, machinery, automation | Materials • Import • Standards |
| Materials and Chemistry | 2,36 | all capital-intensive chains | Energy • Ecology |
| Other industry | 2,31 | Consumer and production demand | Concentration of suppliers |
| Construction | 2,28 | Infrastructure and domestic demand | Timeline • asset quality |
The main system node - data and business services
AUTHOR MODEL
the Narrow Place Index
ICT/services
100
Knot 100
ICT • Finance • Software
1,74, but maximum system criticality
Machines
IMPULSE 2,45
Machines • Electronics
Materials
Other prom.
largest physical wave; bottleneck 55
Logistics
Extraction
Construction
Goss/soc.
APK
Energy
Power is added only with compatible data, payments, standards and protocols.
Release multiplier →
Departmental resources go through several industries
Matrix diagram G
0 — No direct role • 1 — significant • 2 — Host
Finance
Science
RULE 1
Industry
One primary owner
Energy
Principal liability by sector = 1
Transport
APK
RULE 2
Co-executors separately
Health
The Advisory Matrix does not create a second result
Security
Ecology
KNOWLEDGE
Data
A* = A + θK
The effect of academies appears only through confirmed implementation
Demography, innovation and ecology cannot be assigned to one agency
INTERGOVERNMENTAL MISSIONS
MISSION 1
MISSION 2
Demography
Innovations
health + income + housing + education + infrastructure
KPI: healthy years of life, fertility, accessibility
Science + funding + standard + procurement + series
KPI: time from knowledge to commercial/public result
MISSION 3
MISSION 4
Ecology
Resilience
Energy + Transportation + Industry + Cities + APK
KPI: Prevented damage and restored natural capital
Defense + CHS + Health + Networks + Cyber + Logistics
KPI: RTO, MTTR, reserve, share of stress-tested functions
The mission owner coordinates - but does not assign all the results to the co-executors.
Meaning is a testable social ability, not a slogan
EIGHT OUTCOMES
Sovereignty
Reproduction
Optionality
Resilience
Critical Functions with Limitation
KPI: Imports • Savings • suppliers
People, health, skills, capital
KPI: life/HALE • fertility • Depreciation
Real Alternatives to Action
KPI: R&D • high-tech • Standards
Shock absorption and recovery
KPI: RTO • Reserve • stress-test
Trust
Development
Security
Common goods
Predictability and quality of procedures
KPI: law • audit • Services
Expanding productive opportunities
KPI: PPP/capita • productivity • skills
Safety of life and systems
KPI: Incidents • MTTR • stability
Effect wider than the payer
KPI: CO₂e • open science • eddyski
Publication is an issue. An implemented technology, an open standard or a reduced risk is a semantic solution.
Each function creates multiple meanings
COPYRIGHT H • %
Souv.
Resp.
Opts.
Word of mouth.
Dover.
Razv.
Bezop.
Common.
Good News
Strategy
40% — security
defense • right • emergency
Finance
Industry
35% — common goods
ecology • external effects
Infrastructure
Science/image.
Health/soc.
30% - optional
Science • Education
Defence/Right
Environment/External.
Lines = 100%. Weights are fixed in advance.
Power profiles differ more than budget sizes
AUTHOR MODEL 0–100
43,6 / 37,4
58,3 / 50,7
65,7 / 58,2
Russia
China
USA
Medium / Balanced
Medium / Balanced
Medium / Balanced
Synchronization: +4,1 item at cost below 4,1
Scenario • 25%
55,9 → 60,0
the General Index
+4,1 Paragraphs • +7,4%
4,1 p.p.
break-even costs
above - central effect ≤ 0
SENSE
+1,7 / +4,1 / +6,6
closed 10% / 25% / 40% gap
Macro Assessment $0,6–1,0 trillion/year and meaning +4,1 p.p. - different models; they do not add up.
Manage the result passports
EXECUTIVE CONTOUR
| Field | Minimum question |
|---|---|
| Issue addressed | What happens without a project? |
| Sign in | Who pays and what is the risk? |
| Industry | Which Δy and A are changing? |
| Outcome | What is cheaper / faster / more reliable? |
| Meaning | What ability creates the result? |
| Additionality | What wouldn’t have happened autonomously? |
| Verifier | Who independently confirms? |
| Stop rule | At what threshold is the stop? |
PILOT 1
Compatible with IO/SUT
codes • import • VA • carbon • independent replication
PILOT 2
Networks, logistics, methane
stress-test • RTO • Emergency routes • Satellite Verification
PILOT 3
Science and Epidries
Open Standards • Samples • Standby Power • Response Time
Limited Perimeter → Common Base → independent verification → 12–18 months → scale / change / stop.
Combine budgets, industries, results and meanings
CONCLUSIONS
They change demand, regulations, cost of capital, standards and infrastructure.
Ministry ≠ Industry
Fiscal input, financial risk, cross-industry flow, output, and meaning are published separately.
Five books
Machines and materials provide momentum; data, finance, software, and standards hold the chain.
Two priorities
Value is a testable knowledge transition → Standard/Technology → implementation → Risk reduction.
Academy
+4,1 points in the central semantic scenario; break-even coordination — 4,1.
Synchronization
A strong state is able to conduct the resource through industry chains, turn the output into a result and preserve it as life, sustainability, trust and opportunities.
Sources indicated in the presentation 17
- https://www.oecd.org/en/data/datasets/inter-country-input-output-tables.html
- https://rosstat.gov.ru/statistics/accounts
- https://www.stats.gov.cn/sj/ndsj/2025/html/sme03.htm
- https://www.bea.gov/data/industries/input-output-accounts-data
- [/Sources]
- https://data360.worldbank.org/en/dataset/WB_WDI
- https://www.worldbank.org/en/publication/worldwide-governance-indicators
- https://unstats.un.org/unsd/nationalaccount/capdev/resources/details?ResourceID=36&ResourceType=handbook
- https://www.oecd.org/en/data/datasets/input-output-tables.html
- https://minfin.gov.ru/ru/press-center/?id_4=39570-predvaritelnaya_otsenka_ispolneniya_federalnogo_byudzheta_za_2024_god
- https://www.mof.gov.cn/zhengwuxinxi/caizhengxinwen/202603/t20260317_3985436.htm
- https://www.whitehouse.gov/omb/information-resources/budget/historical-tables/
- https://rosstat.gov.ru/folder/313/document/277380
- https://government.ru/news/56347/
- https://komitet-oboron.duma.gov.ru/novosti/a9265059-877c-4b78-9903-68db68f81dea
- https://www.stats.gov.cn/english/PressRelease/202602/t20260228_1962661.html
- https://english.www.gov.cn/news/202503/05/content_WS67c7ba5dc6d0868f4e8f05cf.html