Brief annotation
About the document
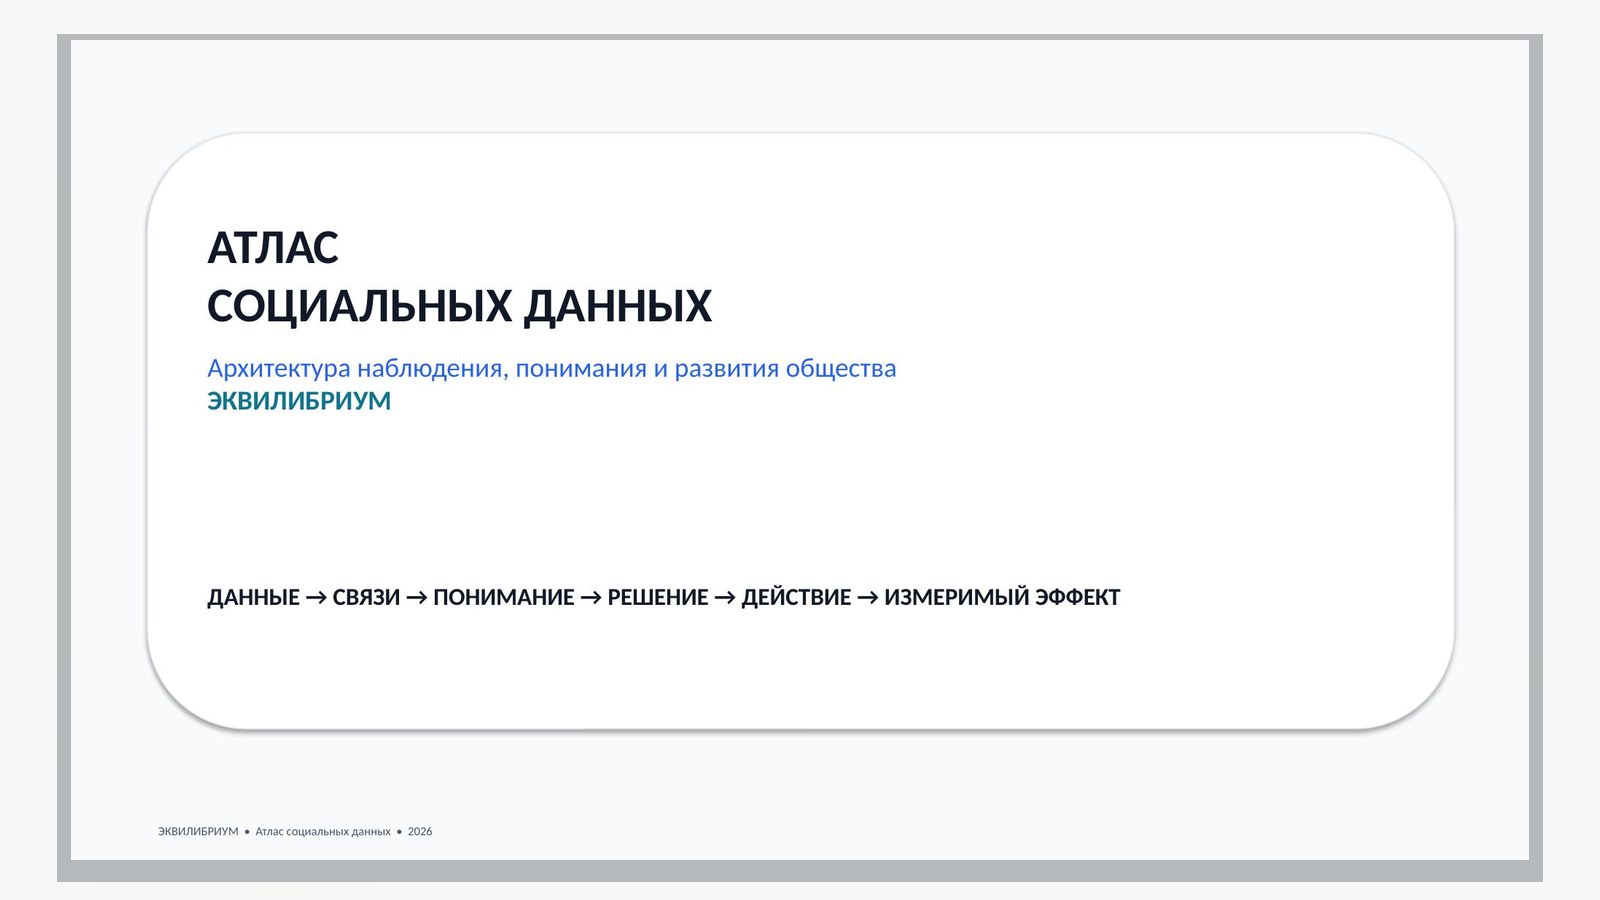
The material describes an architecture for observing, understanding and developing society through data, connections, decisions and measurable impact.
Атлас_социальных_данных_ЭКВИЛИБРИУМ_презентация.pptx
Downloading the document...
EQUILIBRIUM
The Social Data Atlas is a digital system that combines information about people, families, territories, organizations, infrastructure, initiatives, resources, risks and outcomes into a single verifiable model of social reality. Its task is not just to store statistics, but to give grounds for decisions: where intervention is required, what resources are already available, who is able to act, what measures give results and how the quality of life changes.
System document • 2026
1. The Atlas Mission
The mission of Atlas is to create a single language of social data and move from disparate departmental datasets to a holistic picture of society, in which not only problems but also the potential for development are visible.
- see the social reality at the level of the country, region, municipality, territory, community and project;
- Compare the needs of the population with the infrastructure, financing, competencies and existing programs;
- Identify risk areas prior to a crisis;
- measure the effectiveness of social projects and government measures;
- to form an evidence base for NGOs, business, authorities, development institutions and citizens;
- support the design of new social services and targeted solutions.
2. The main principle: from statistics to the system of actions
Ordinary statistics answer the question "what happened?". The Atlas should answer six questions at once: what is happening, where, with whom, why, what resources are available and what action will have the greatest effect.
| Level | Question | Result |
|---|---|---|
| Observation | What's going on now? | Events, indicators, dynamics |
| Diagnostics | Where is the deviation and who has a problem? | Risk and Vulnerability Map |
| Causality | What factors are related to the situation? | Hypotheses and causal relationships |
| Resources | Who and what can influence? | Map of organizations, programs, finance, infrastructure |
| Decision | Which action is preferable? | Scenario of intervention |
| Evaluation | Has the state changed after the action? | Measurable social impact |
3. Objects of social model
The core of the Atlas is built not around one registry, but around interconnected objects. Each object receives a unique identifier, a set of attributes, sources of confirmation, territorial binding and connections with other objects.
| Object | What we describe | Key connections |
|---|---|---|
| Person | socio-demographic and life parameters in an impersonal/legal contour | family, services, education, work, territory |
| Family / Household | composition, living conditions, load, access to services | housing, income, support measures |
| Territory | population, environment, infrastructure, risks, events | organizations, projects, facilities, indicators |
| Organization | NPO, institution, enterprise, foundation, community | projects, people, resources, partnerships |
| Project / Program | purpose, task force, budget, activities, KPI | organizations, territories, results |
| Resource | finance, premises, equipment, competences, volunteers | projects, organizations, needs |
| Need | deficit, problem, request, risk | target group, territory, project |
| Event | change, crisis, event, appeal, intervention | time, place, participants, consequences |
| Result | output, effect, change of state | project, indicator, territory, group |
4. 19 layers of the Social Data Atlas
| № | Layer | Contents |
|---|---|---|
| 01 | Demography | number, age, migration, household structure |
| 02 | Income and welfare | income, expenditure, poverty, debt burden |
| 03 | Employment and work | employment, professions, vacancies, unemployment, cooperation |
| 04 | Education | accessibility, trajectories, competencies, additional education |
| 05 | Health and Well-being | accessibility of infrastructure, prevention, social determinants |
| 06 | Family and childhood | family support, children, parenthood, family infrastructure |
| 07 | The older generation | active longevity, care, employment, accessibility of the environment |
| 08 | Inclusion and accessibility | barriers, special services, accessible environment |
| 09 | Housing and environment | housing, improvement, public accessibility |
| 10 | Security | social risks, emergency events, prevention |
| 11 | Culture and identity | institutions, participation, heritage, local communities |
| 12 | Sport and activity | facilities, availability, participation, mass programs |
| 13 | Civic activity | NGOs, volunteering, initiatives, self-organization |
| 14 | Social services | suppliers, capacities, queues, quality, result |
| 15 | Digital accessibility | communication, digital services, skills, digital divide |
| 16 | Environment and health | Environmental quality and social impacts |
| 17 | Social economy | social entrepreneurship, cooperation, employment, procurement |
| 18 | Financing for development | budgets, grants, donations, investments, PPA |
| 19 | Social impact | outputs, results, sustainability, change in quality of life |
5. Unified Register of NGOs and Social Initiatives
To work with the NGO ecosystem, Atlas should not become a copy of the catalog of organizations, but a “living passport” of the territory’s ability to solve social problems.
- NGO passport: legal status, directions, geography, team, competencies, experience;
- portfolio of projects: goals, groups, budgets, calendar, results, partners;
- Sources of funding and history of support;
- material and intangible resources;
- proven practices and replicable solutions;
- needs of the NGO itself: financing, premises, personnel, IT, partners;
- reputation and evidence profile: reporting, transparency, confirmed results.
6. Indicators: three-tier system
| Level | Meaning | Examples |
|---|---|---|
| A. Status | What Happens to Society and Territory | employment, access to services, migration balance |
| B. Actions | What the system does | Programme coverage, number of services, resources, partnerships |
| C. Effect | What has changed as a result of action | increasing independence, reducing the deficit, improving accessibility |
For each indicator are fixed: definition, formula, unit of measure, source, periodicity, geography, acceptable level of data quality, owner, limitations of use and connection with development goals.
7. Map of social needs
The need should be an independent object of data, and not just the text of the appeal. This allows you to aggregate requests, compare them with the offer and automatically find deficits.
| Parameter of need | Description |
|---|---|
| Type | services, infrastructure, financing, employment, education, assistance, security, etc. |
| Mediator | person, group, community, organization, territory |
| Geography | location, address, municipality, region |
| Intensity | The extent and depth of the deficit |
| Urgency | Normal / High / Critical |
| Confirmation | official data, appeals, survey, expert assessment |
| Possible solutions | existing programmes, implementers, resources, new initiative |
8. Map of resources and opportunities
Atlas should show not only "where is bad", but also "what is already there". The resource card turns social analytics into an operating system of cooperation.
- financial resources: budgets, grants, donations, social investments, targeted programs;
- infrastructure: premises, centers, sports and cultural facilities, transport, digital sites;
- human capital: specialists, mentors, volunteers, experts;
- organizational resource: NGOs, institutions, business, initiative groups;
- technologies and data: digital services, platforms, methods, educational products;
- Time and availability of the resource: when it is free and under what conditions it can be used.
9. Hypergraph of social connections
The basic form of Atlas presentation is the hypergraph. Nodes represent people, organizations, projects, territories, resources, needs, and indicators; connections show participation, funding, impact, service delivery, partnership, affiliation, and cause-and-effect relationships.
This approach allows you to see not separate tables, but the configuration of the social system: who is associated with whom, where overload occurs, which organizations are centers of trust, which resources are isolated and which projects are able to cover several needs at the same time.
10. Social passport of the territory
| Passport Block | What includes |
|---|---|
| People | population structure, groups, dynamics |
| Quality of life | Key social indicators |
| Needs | Deficits and risks |
| Infrastructure | facilities and capacities |
| Organizations | NPOs, institutions, businesses, communities |
| Projects | Current and planned initiatives |
| Resources | finance, personnel, premises, technology |
| Events | Significant changes and treatment |
| Effect | Programme results and dynamics |
| Forecast | scenarios for 1/3/5 years |
11. Analytical regimes
- Deficit map - where the need exceeds the available resource.
- Coverage map - which groups and territories receive services and which fall out.
- Map of cooperation - who is already working on the topic and with whom it makes sense to unite.
- Efficiency map - what practices give a measurable result per unit of resource.
- Risk maps are early signs of a worsening situation.
- Map of potential — unused assets of the territory and social capital.
- Scenario mode - a forecast of the consequences of various management decisions.
- Single window mode - selection of projects, programs and performers for a specific need.
12. Not as an analysis, but as a navigation
A uniform rating of territories or organizations is allowed only as the top navigation layer. Decomposing indicators and evidence should remain at the core. Otherwise, the complex social reality turns into a dispute about a singular number.
| Index | Purpose |
|---|---|
| Social Welfare Index | General condition of the Territory |
| Accessibility Index | Access to key services and infrastructure |
| Social activity index | density of initiatives, NGOs, volunteering, participation |
| Resource security index | Availability and availability of resources |
| Vulnerability index | A combination of risk factors |
| Proven Effect Index | Effectiveness of programmes and projects |
| Cooperation index | Connectivity of participants and cross-sectoral partnerships |
13. Data and trust contour
The Atlas should distinguish between published data, departmental data, organization data, user signals, and analytical findings. It is important for each fact to maintain the origin and level of trust.
| Source class | Examples | Monitoring |
|---|---|---|
| Official registries | state statistics, registers, open data | source ID, date of update |
| Organizational data | Reporting by NGOs and institutions | verification, documents, responsible |
| Project data | activities, budgets, KPI | Primary evidence |
| Messages and Signals | citizens' requests, community messages | anti-duplication, moderation, geo-binding |
| Research | surveys, monitoring, expert assessments | Methodology and sampling |
| Estimates | indices, forecasts, models | version of the formula, calculation date, explicability |
14. The rules of responsible work with data
- privacy by design: personal data should not become a public layer of the Atlas;
- Minimization: only the data required for a specific social task is collected;
- separation of identification, analytical and public contours;
- access control by roles and logging actions;
- Depersonalization and aggregation for public cards;
- the right to correct erroneous data in cases stipulated by law;
- transparency of calculation methods and origin of indicators;
- banning the automatic adoption of high-value decisions only on the basis of an opaque rating.
15. Integration layer
The Atlas is designed as a supersystem, not another closed base. Its key function is to connect external registers, platforms and information systems through API and a single object dictionary.
| Integration circuit | Function |
|---|---|
| State systems | official indicators, support measures, infrastructure |
| the NGO Platform | organizations, projects, practices, support requests |
| Grant Systems | competitions, applications, financing, results |
| Municipal and regional IP | local infrastructure, appeals, programs |
| SFERA | initiatives, communities, events, cooperation |
| ECO-PPA | resource and project contours, risk prevention |
| SPECZASHCHITA | performers, cooperation, pilots, production circuit |
| EQUILIBRIUM | analytics, hypergraph, prediction, scenarios and results control |
16. Platform architecture
- Layer 1 - data sources and connectors;
- Layer 2 - single data model and identifiers;
- Layer 3 - a repository of facts and time series;
- Layer 4 - graph of connections and ontology;
- Layer 5 - quality, verification and origin of data;
- Layer 6 - analytics, indices and models;
- Layer 7 - cards, dashboards and social passports;
- Layer 8 - design and cooperation contour;
- Layer 9 - API for external services;
- Layer 10 - Access management, security and audit.
17. User Roles
| Role | What Gets |
|---|---|
| Citizen | public card, available services, projects, opportunities for participation |
| NPO | organization passport, territory analytics, partners, grants and needs |
| Municipality | Single social passport and deficit card |
| Region | comparison of territories, programs and dynamics |
| Federal level | single monitoring, scenarios, interregional imbalances |
| Business | social investment points and partnership projects |
| Foundation / Development Institute | the Initiatives funnel, evidence check and effect |
| Researcher | anonymized data, methods and time series |
| Operator EQUILIBRIUM | cross-cutting model of connections, risks, resources and solutions |
18. Minimum viable product (MVP)
The first launch should not attempt to cover the entire country and all the data. One region or group of municipalities and five interconnected registries are sufficient.
- Register of NGOs and social organizations;
- register of social projects;
- register of needs and problems of the territory;
- Register of resources and infrastructure;
- Register of indicators and results.
MVP should be able to: show the map; open the passport of the territory; find an organization or project; compare the need with the resource; form a project card; build a basic dashboard; upload an analytical note.
19. Pilot "Atlas of NGOs and social activity"
The practical first module can be deployed around existing NPO platforms. Instead of competing with them, Atlas receives cataloguing from them and complements it with analytics, connectivity, and result measurement.
| Stage | Result |
|---|---|
| 1. Inventory | Map of platforms, registries and open data sets |
| 2. Normalization | common fields of organization, project, territory and result |
| 3. Loading the pilot | 500–5000 organizations of one/several territories |
| 4. Contacts | topics, partnerships, financing, projects, territories |
| 5. Requirements | Collection of requests from NGOs and territories |
| 6. Analytics | map of density, gaps, specializations, resources |
| 7. Cooperation | Finding partners and collecting project consortia |
| 8. Effect | Single minimum standard for reporting results |
20. 20 Atlas Key Screens
- 1. Main country map
- 2. Passport of the region
- 3. Passport of the municipality
- 4. Map of NGOs
- 5. NPO Card
- 6. Project Map
- 7. Project Card
- 8. Map of needs
- 9. Need card
- 10. Resource map
- 11. Resource card
- 12. Infrastructure map
- 13. Map of social risks
- 14. Dashboard Quality of Life
- 15. Dashboard Grants and Funding
- 16. Partnerships graph
- 17. The Consortium Designer
- 18. Scenario forecast
- 19. Monitoring of social impact
- 20. Center for Reports and Analytical Notes
21. Management cycle
Atlas becomes a work system only when data is locked into a regular management cycle.
| Step | Action |
|---|---|
| 1 | Collect and update data |
| 2 | Identifying a change or deficit |
| 3 | Identify the target group and territory |
| 4 | Identify causes and related factors |
| 5 | Compare available resources and performers |
| 6 | Create a project solution |
| 7 | Assign Result Indicators |
| 8 | Run Execution |
| 9 | Measure changes |
| 10 | Maintain practice and scale with proven effect |
22. EQUILIBRIUM As an analytical core
In the EQUILIBRIUM architecture, the Social Data Atlas is the outline of the observed social reality. It gives the system the actual basis for hypergraphing, forecasting, and decision design. SFERA provides a space for initiatives and participation; ECO-PPA provides a mechanism for resource concentration and threat prevention; and SPECZASHCHITA provides a cooperative execution circuit. The Atlas links all four elements through a single evidence-based data model.
23. What counts as success
- data from different sources are comparable and have a clear origin;
- For each territory, simultaneously visible needs, resources and performers;
- NGOs and projects can be found not only by name, but by the ability to solve a specific task;
- the manager sees not only expenses and activities, but a change in state;
- the project can be traced from the problem to the resource, action, result and evidence;
- Best practices become replicable, and repeated failures become visible.
- The system helps to make decisions faster, more accurately and with less manual reconciliation.
24. Roadmap for deployment
| Phase | Contents | Key result |
|---|---|---|
| 0. Design | ontology, dictionary, data policy, architecture | Technical and methodological specification |
| 1. MVP | 5 registers, 1 pilot territory, base maps | working prototype |
| 2. Pilot of NPO | integration of catalogues and project data | Map of social activity |
| 3. Social passport | indicators, needs, infrastructure | Unified Territory Profile |
| 4. Cooperation | search for resources, partners, consortiums gathering | Project Action Outline |
| 5. Effect | Results metrics and evidence | Performance assessment |
| 6. Forecast | risks, scenarios, early warning | Analytical Core EQUILIBRIUM |
| 7. Scaling | Interregional and Federal Integration | the National Atlas of Social Data |
25. Final formula
DATA → RELATIONS → UNDERSTANDING → SOLUTION → ACTION → MEASURABLE EFFECT
The Social Data Atlas is not another portal or another registry. It is an infrastructure of public knowledge: a single environment in which the state of society becomes observable, resources visible, initiatives comparable, results demonstrable, and development manageable.
Annex. Minimum social object card
| Field | Purpose |
|---|---|
| object_id | stable unique identifier |
| object_type | Type of ontology object |
| name | Normalized name |
| description | Brief and informative description |
| geo_id | territorial binding |
| time_from / time_to | Period of fact |
| source_id | Data source |
| evidence_id | proof/primary document |
| confidence | Level of trust |
| owner | Responsible for data |
| relations | Connection with other objects |
| metrics | indicators and values |
| access_class | Access Class |
| updated_at | date of last update |
Source materials
Originals and versions of the document
- Атлас_социальных_данных_ЭКВИЛИБРИУМ.docxDOCX · main document
- Атлас_социальных_данных_ЭКВИЛИБРИУМ_презентация.pptxPPTX · related version
Other editions in web format
Each version is disclosed separately; the sequence of the source document is saved.
ATLAS SOCIAL DATA Architecture of observation, understanding and development of society EQUILIBRIUMAtlas_social_data_EQUILIBRIUM_presentation.pptx · web text+
DATA → RELATIONS → UNDERSTANDING → SOLUTION → ACTION → MEASURABLE EFFECT
1. Why do we need Atlas?
From scattered statistics to a holistic social picture
• Unified language of social data for the state, NGOs, business and citizens.
• Simultaneous display of problems, resources, performers and results.
• Early identification of social risks prior to transition to crisis.
• Evidence-based assessment of social projects and government measures.
• Support for targeted solutions and design of new services.
2. Atlas answers six questions
The main transition: from the description of the past to the system of actions
What's going on?
Where?
With who?
Why not?
What resources are available?
What action will produce the result?
3. 19 layers of social reality
Atlas is not built around one base, but around interconnected layers
1. Population
2. Families
3. Health
4. Education
5. Revenues
6. Employment
7. Housing
8. Culture
9. Sport
10. Young people
11. The older generation
12. Inclusion
13. Security
14. Ecology
15. Mobility
16. NPO
17. Social projects
18. Resources
19. The social effect
4. Unified Register of NGOs and Initiatives
Not a directory of organizations, but a map of the territory’s ability to solve problems
• NPO passport: status, team, geography, competence, experience.
• Project portfolio: goals, groups, budgets, partners, results.
• Funding and support history.
• Material and intangible resources.
• Needs of the NGO itself: personnel, premises, IT, partners, financing.
• Evidence profile: transparency, reporting, confirmed effect.
5. Needs map + resource map
Social analytics becomes an operational system of cooperation
NEEDS
RESOURCES
• type of problem
• Task Force
• geography
• urgency
• scale
• Confirmation
• Finance
• infrastructure
• specialists
• NPOs and Institutions
• Technologies and Data
• availability in time
6. Hypergraph of social connections
Basic Atlas presentation form
NPO
RESOURCES
PEOPLE
PROJECT
TERRITORIES
NEEDS
INDICATORS
7. Social passport of the territory
One screen for manager, NPO, investor and analyst
State of population
Key risks
Needs
Infrastructure
NPOs and performers
Financing
Dynamics of indicators
Projects and effect
8. Analytical regimes
Atlas should show not only "what is", but also "what to do"
Deficit map
Coverage map
Map of cooperation
Performance Map
Risk map
Capacity map
Scenario mode
One Solution Window
9. Platform architecture
10 Technology Layers
1. Sources and connectors
2. Unified data model
3. The Fact Depository
4. Count and Ontology
5. Quality and Origin
6. Analytics and Models
7. Cards and Dashboards
8. Project outline
9. API external services
10. Security and audit
10. The contour of trust and responsible work with data
Atlas should be useful without becoming a system of total observation
• Privacy by design and minimization of collected data.
• Separation of identification, analytical and public contours.
• Depersonalization and aggregation for public cards.
• Role access and logging actions.
• Transparent origin of data and calculation methods.
• No high-value decisions on an opaque rating only.
11. MVP: first working circuit
One region / group of municipalities + 5 Interconnected registries
NGOs and social organizations
Social projects
Needs and challenges
Resources and infrastructure
Indicators and results
• Territory map
• NPO/project search
• Comparison of need and resource
• Project Card
• Basic Dashboard Effect
12. 20 key screens
The Atlas interface should guide the user from the map to the solution
1. Main map
2. Passport of the region
3. Passport of the municipality
4. Map of NGOs
5. NPO Card
6. Project Map
7. Project Card
8. Map of needs
9. Need card
10. Resource map
11. Infrastructure
12. Social risks
13. Quality of life
14. Grants and funding
15. Partnerships graph
16. The Consortium Designer
17. Scenario forecast
18. Effect monitoring
19. Reporting Center
20. Search for solutions
13. Roadmap for deployment
From the pilot of NGOs to the national social infrastructure
Pilot
Connectivity
Analysis
Scaling
EQUILIBRIUM
1 region / 5 registers
API + External Platforms
Risks, Deficits and Efficiency
regions and industry contours
a Single Analytical Core
Social Data Atlas = public knowledge infrastructure and navigation system to measurable social outcome.