Brief annotation
About the document
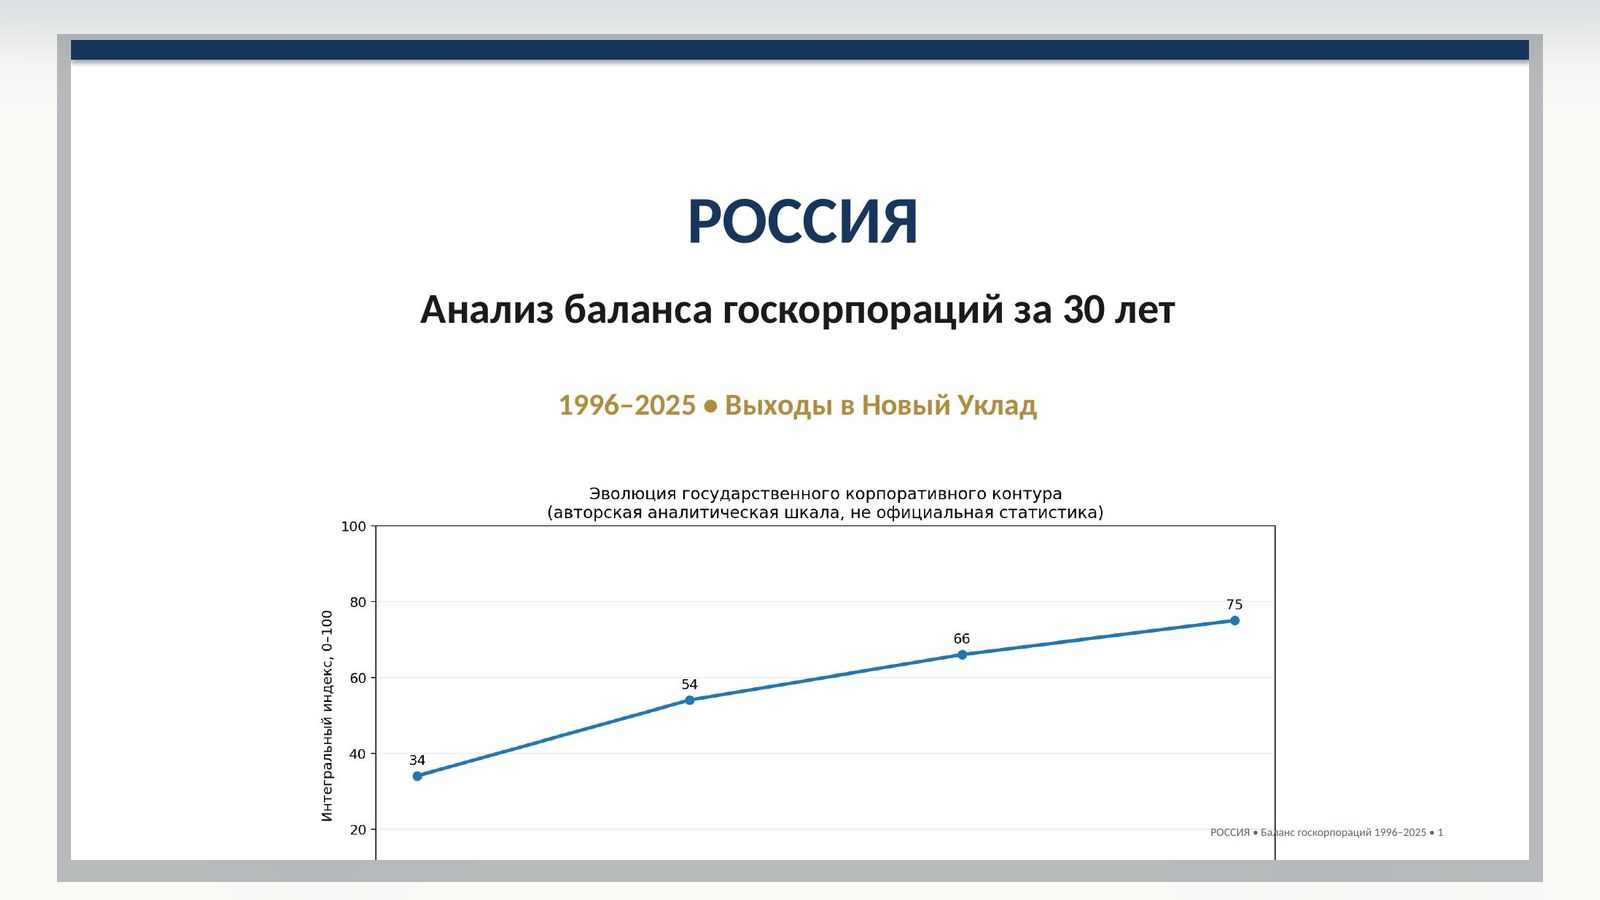
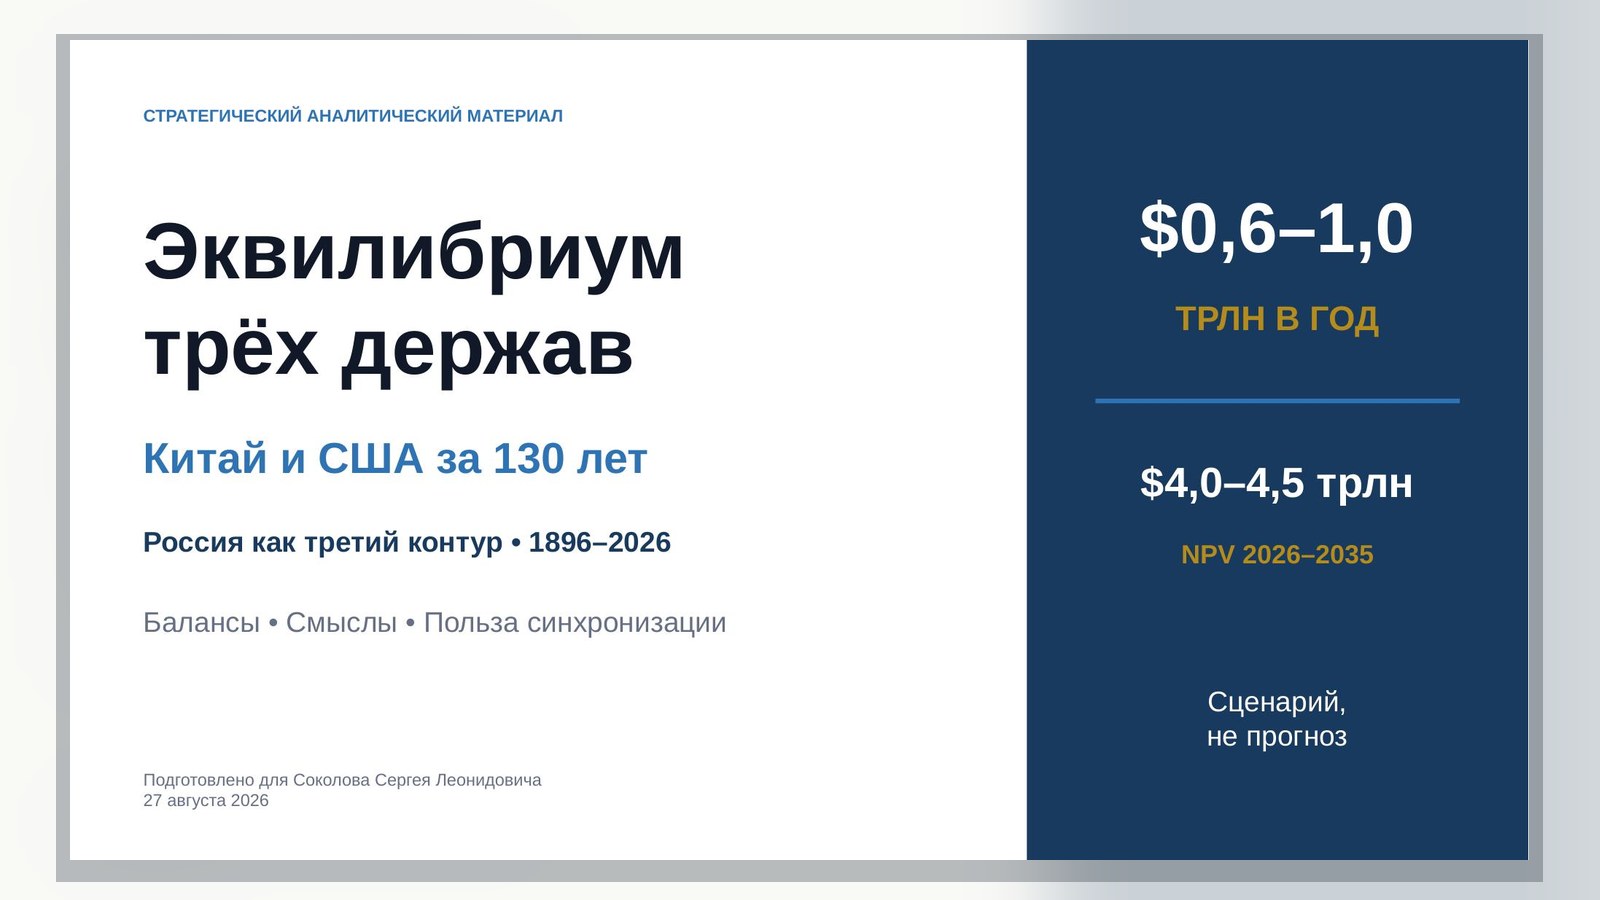
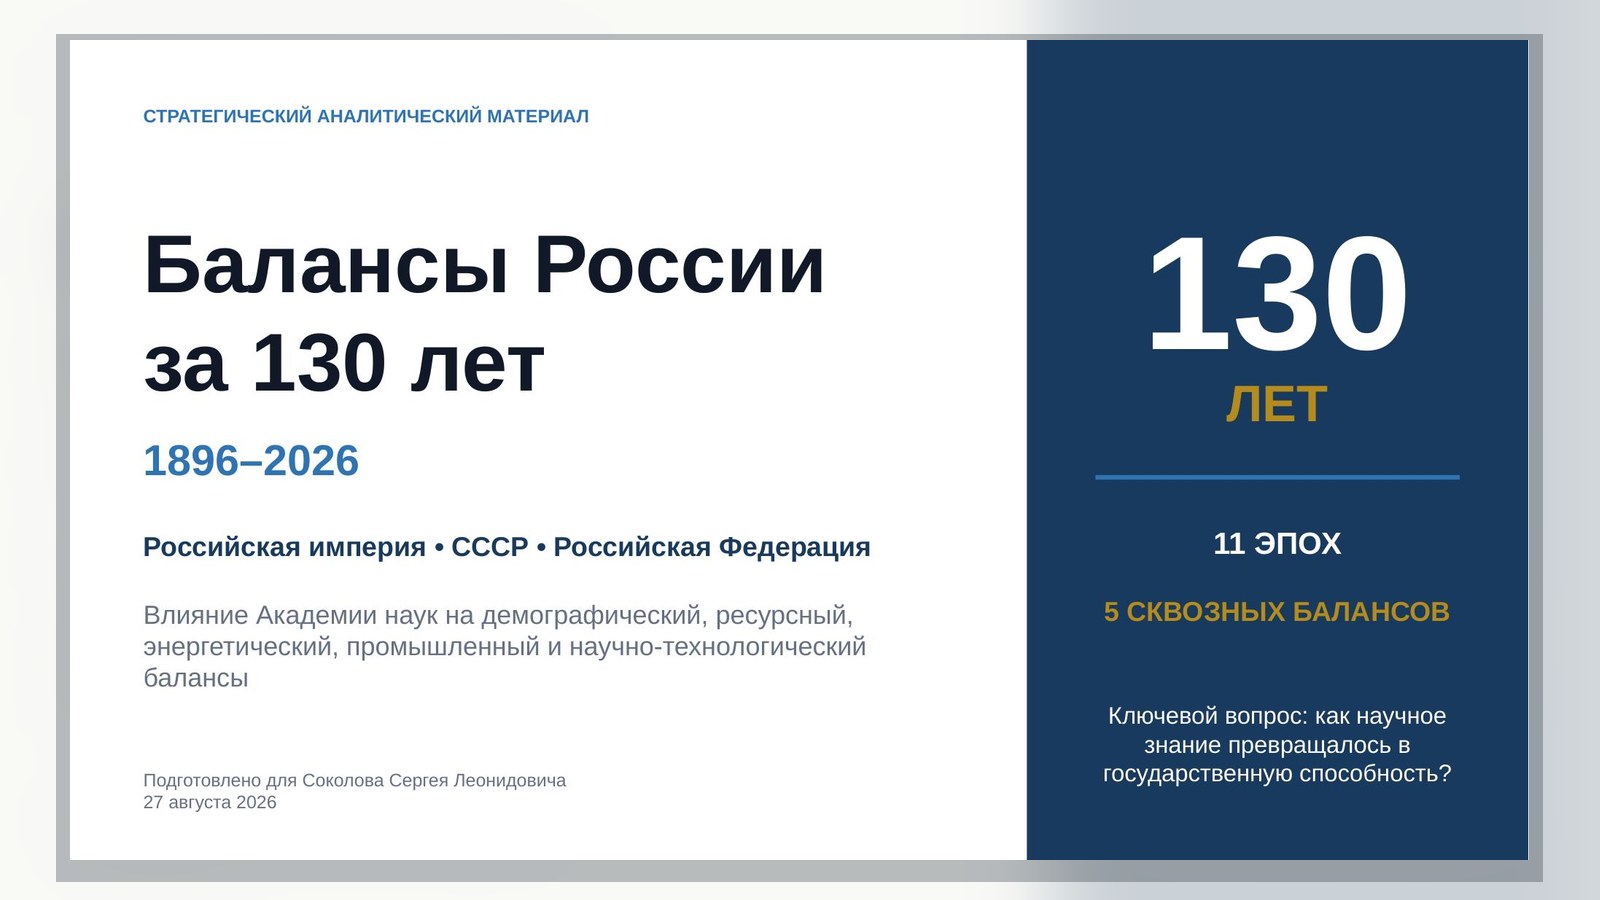
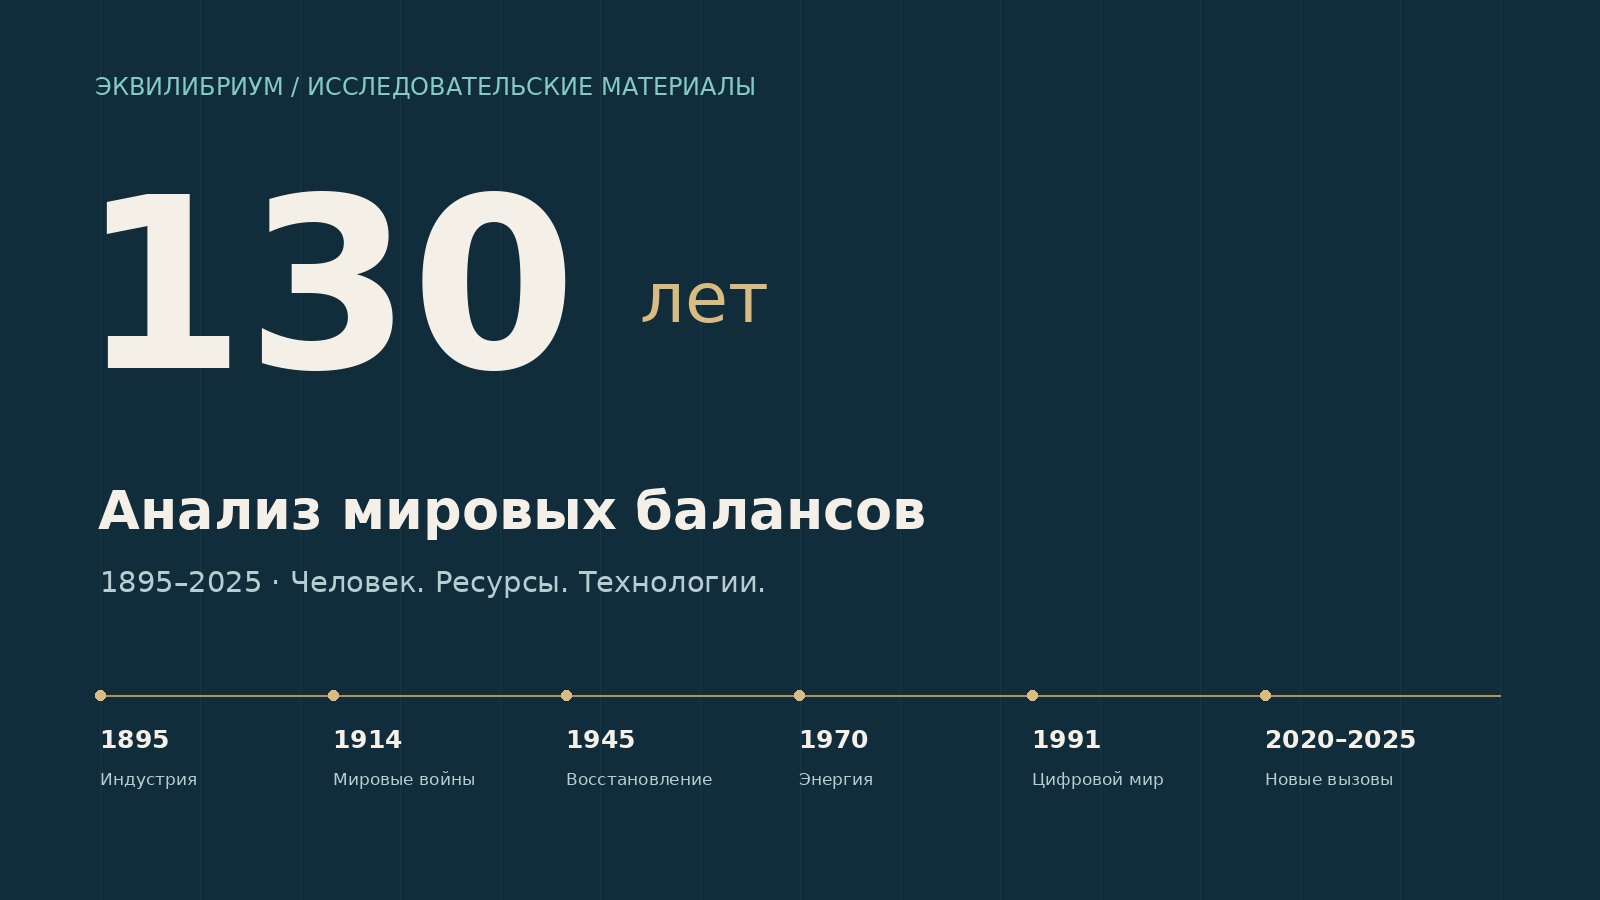
Analytical material on long-term changes in key national balances of Russia.
Analiz_balansov_Rossii_1995-2025.pptx
Downloading the document...
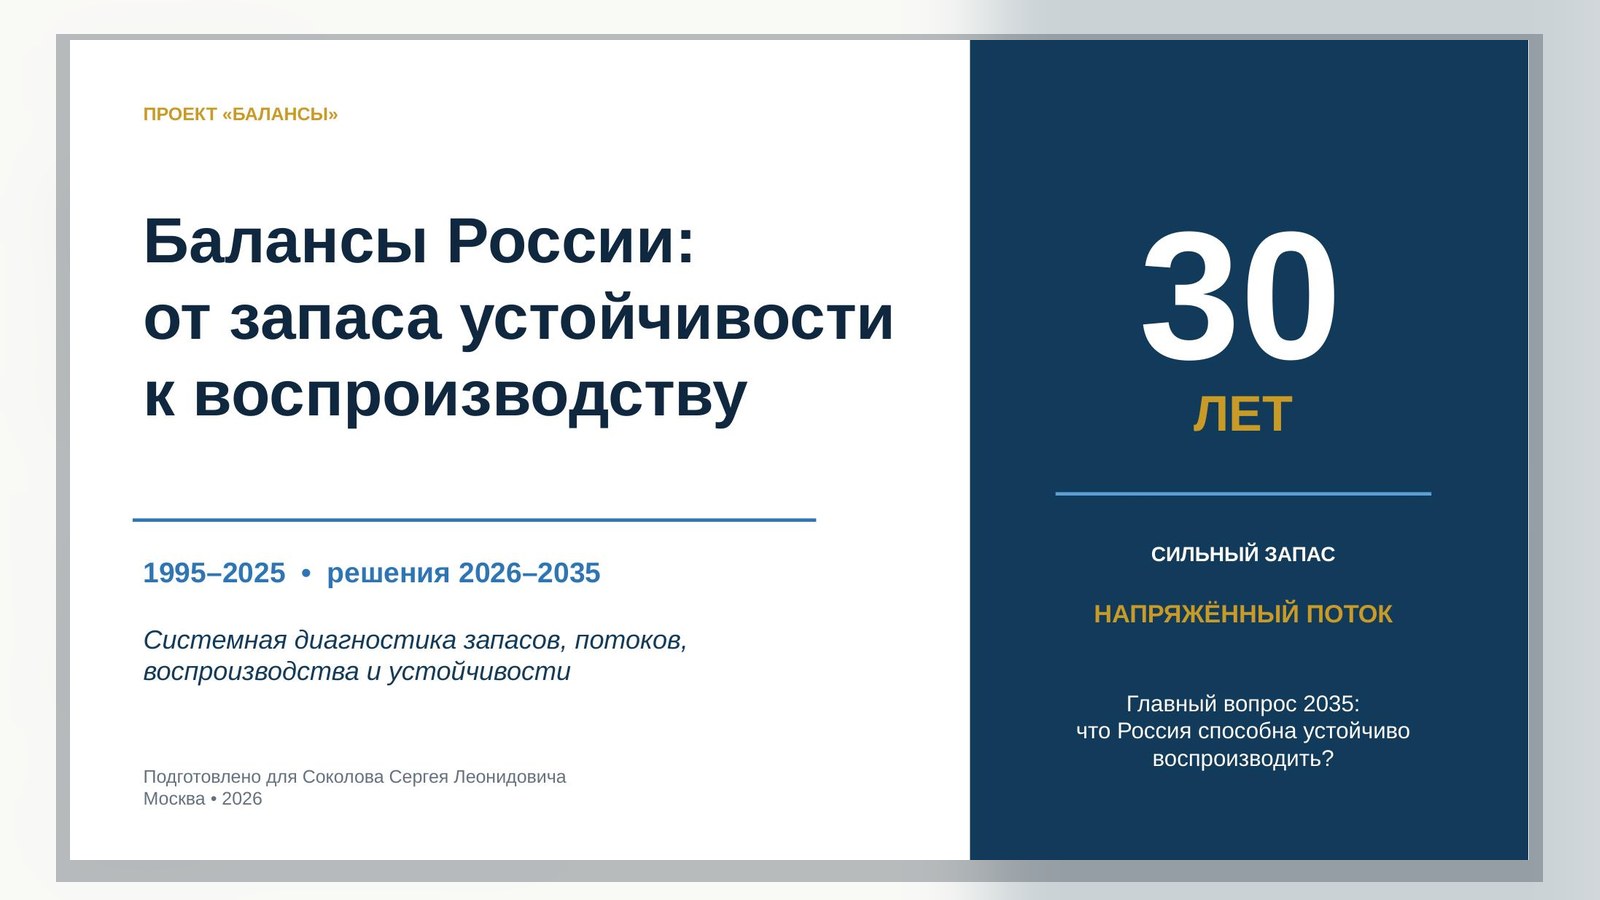
System diagnostics of stocks, flows,
Reproduction and Sustainability
Russia has moved from a deficit of basic stability to a surplus of sovereign reserves, but has not achieved a balanced reproduction of human, technology and fixed assets.
Prepared for: Sokolov Sergey Leonidovich
Data horizon: 1995–2025
Cut Date: 27 August 2026
Moscow • 2026 • version 1.0
Passport document
Table 1. Research framework
| Parameter | Contents |
|---|---|
| Subject | A connected system of demographic, social, macroeconomic, financial, external, production, technological, resource, infrastructure, territorial and environmental balances. |
| Period | 1995–2025; earlier values are given only as a base. Data for the year 2025 are final or preliminary as of the cut-off date. |
| Unit of analysis | Stock → tributaries → Reproduction → Usage → Outflow → Losses → Commitments. |
| Purpose | Strategic diagnostics: where the margin of stability has already been created, where the flow worsens, and where the reproduction mechanism itself is broken. |
| Status of evaluations | Statistical facts are separated from expert synthetic estimates. The color matrix is not an official government index. |
How to read the conclusions The surplus of a separate contour is not equal to the stability of the entire system. For example, an export or budget reserve may coexist with demographic deficits, fund depreciation, and technological dependence.
Constraints on comparability
- The territorial base has changed; after 2014 and 2022, the long ranks of the population and regional indicators require separate marking.
- Transitions between OKVED classifiers, revisions of national accounts, labour force surveys and poverty methodologies form series gaps.
- After 2022, the detailing of part of foreign trade and industry statistics is limited; where there is no full range, aggregates of the Bank of Russia and Rosstat are used.
- Costs are not directly compared without deflation; priority is given to real indices, GDP shares and physical volumes.
Summary for decision
Russia’s thirty-year trajectory is not a linear path from crisis to sustainability, but a change of type of imbalance. V 1990- liquidity and institutional deficits dominated 2000e) recovery based on unloaded capacity and export rent 2010-e - deceleration under already established reserves 2020e) forced structural adaptation, accompanied by a shortage of labor, capital and technology.
Twelve Conclusions
- The sovereign balance is stronger. The state’s low debt burden, international reserves and a steadily positive commodity balance create protection against the classical payment crisis of the 1990s.
- The growth rate has become weaker than the quality of stocks. Real GDP growth of almost two times 1999–2008 The average rate of change is about 1% in 2014–2019 years; in 2025 The growth slowed to 1,0%.
- Financial stability is becoming increasingly difficult to convert into investment flows. In 2025, the economy as a whole was a net lender, but non-financial corporations were a net borrower, and the high cost of money held back capacity renewal.
- Demography has become a major systemic deficit. The number of births in 2024 was about 1,22 million - less than in the mid-1990; the short window of natural equilibrium 2013–2015 closed.
- The job market is both strong and vulnerable. Unemployment of 2,2% in 2025 means an almost full load of labor supply, but also a chronic shortage of personnel and pressure on the cost of living.
- The social balance has improved on poverty but not completed on income quality. The proportion of the population below the poverty line has decreased from 29,0% in 2000 to 6,7% in 2025; the gap by region and group remains significant.
- The scientific and technological contour does not reproduce the scale. Research and development staff has declined by about 1,06 Millions of people in 1995 the Year 676 thousands in 2024 year, and the costs remain 1% GDP.
- Fixed assets are a hidden liability. Average wear and tear reached 42,3% in 2024; in a number of infrastructure and utility systems it is higher.
- Energy and food balances are physically sustainable, but the value of exports depends on processing depth, logistics, and access to technology.
- The territorial balance is not balanced. The concentration of people, income, investment and scientific personnel in several agglomerations increases the outflow from peripheral regions.
- Environmental balance remains negative for waste accumulation and local wear and tear of natural systems. Mass of production and consumption waste in 2024 The year - about 8,5 billion tons.
- The main task of 2026–2035 is to switch policy from the protection of stocks to the reproduction of flows: people, competencies, fixed capital, technologies, soils, water and ecosystems.
The formula of the era of a strong balance of stocks is a tight balance of flows. The solution is not to spend the reserves as such, but to turn them into productivity, human capital and a longer asset life cycle.
Table 2. Summary Status Bar
| Contour | Status 2025 | What Holds | The main gap |
|---|---|---|---|
| Demography | Critical | Migration inflows, large generations of older people | Low birth rate, ageing, regional outflow |
| Macroeconomics | Unstable | Full load of labor and capacity, budget demand | Growth 1,0%, high inflation sensitivity |
| Budget and Debt | Tense | Public debt about 15% GDP, NWF | Deficit of 2025, dependence of income on commodity conditions |
| Money and Finance | Tense | Capital of banks, savings of the population | Average key rate 19,2% in 2025 year |
| External | Resilient with reservations | Surplus of goods and current account, reserves | Narrowing surpluses, asset restrictions and settlements |
| Work and income | Unstable | Low unemployment, rising wages | Shortage of staff, productivity, income inequality |
| Science and technology | Tense | Schools and the Demand for Localization | R&D about 1% GDP, staff reduction |
| Energy and resources | Resilient with reservations | Scale of stocks and production | Depth of processing, logistics, carbon risks |
| Food | Steady | Increased productivity and exports | Seeds, machinery, climate volatility |
| Infrastructure | Unstable | High housing input, new corridors | Network wear, bottlenecks, maintenance |
| Territories | Tense | Agglomeration effects, supporting cities | Concentration of capital and demographic polarization |
| Ecology | Tense | Natural capital, environmental programs | Waste, water, air, accumulated damage |
Source: Expert synthetic evaluation of the author based on official series; not official index.
Contents
1. Method of national balances
2. Thirty Years: Six Regimes
3. Production, investment and productivity
4. Budget, money and financial flows
5. External balance
6. The demographic balance
7. Labor, income and human capital
8. Industry, technology and science
9. Energy and material balance
10. Food, land and water
11. Infrastructure and housing
12. Territorial balance
13. Ecology and climate
14. Integrated matrix
15. Scripts 2026–2035
16. Strategic agenda
Conclusion
Annex A. Passports of indicators
Annex B. Methodological reservations
Sources
All sections form one causal chain: demography determines the supply of labor; productivity and capital - output; budget and external position - the space of maneuver; technology, infrastructure and ecology - the duration of this maneuver.
1. Method of national balances
Balance is not just accounting equality. For strategic analysis, it shows whether the circuit is able to maintain its stock without constantly increasing hidden liabilities. GDP can grow with a reduction in population; the budget can be surplus with accelerated network wear; exports - high with the loss of technological depth. Therefore, the assessment is built simultaneously in stock, flow and reproduction.
Basic Equality Balance = Reserves + The tributaries + Reproduction − Consumption − Ottoki − Losses − Commitments.
Table 3. Six dimensions of each balance
| Measurement | Question | Example of indicator | Risk signal |
|---|---|---|---|
| Stock | What is already accumulated? | Population, capital, reserves, soils, infrastructure | Decrease in volume or quality |
| Stream | What comes in and out every year? | Births and deaths, investments and disposals, exports and imports | Sustained negative net flow |
| Reproduction | Is the stock updated? | TFR, training, commissioning, R&D | Update below disposal |
| Capacity | What is the safe load limit? | Availability of labor, network, budget rule, water stress | Approaching physical limitation |
| Quality | How much stock is produced? | OPG, productivity, processing depth | Increase in quantity when impact falls |
| Reserve | How long does the shock last? | Liquidity, NWF, capacity, grain reserves | Coverage below the reaction horizon |
Rules of interpretation
- A positive flow is considered stable only if the quality of the stock is maintained.
- One-time shock is separated from the structural trend: the crisis of 2009 is an external shock, the demographic decline after 2016 is a structural process.
- Stock and liability are counted together: the introduction of housing without utility capacity increases the future load; mining without reclamation is an environmental debt.
- The national average does not replace the territorial distribution: the surplus of vacancies in one agglomeration does not compensate for the outflow in another territory.
- Target corridors are defined as management guidelines, not a point forecast.
2. Thirty Years: Six Regimes
The main mistake of long analysis is to consider 1995–2025 years as a single statistical series. During this time, institutions, currency regime, ownership structure, demographic base, trade geography and the scale of state participation have changed. It is more useful to see six regimes, each of which has solved one group of deficits and formed the next.
Table 4. Periodization by type of imbalance
| Period | Dominant regime | What is restored | What is Accumulated as Risk |
|---|---|---|---|
| 1995–1999 | Liquidity and Institutions Crisis | Market prices, private sector, household adaptability | Poverty, non-payment, debt, demographic shock, wear and tear |
| 2000–2008 | Recovery growth and resource supercycle | Revenues, budget, reserves, capacity utilization | Raw material concentration, lag in investment in quality |
| 2009–2013 | Anti-crisis stabilization and plateau | Banking stability, social spending, low unemployment | Slowing productivity, the beginning of a demographic turnaround |
| 2014–2019 | Sovereignization and adaptation | Floating rate, import substitution in agriculture and finance | Investment pause, technology, real income |
| 2020–2021 | Pandemic shock | Digital services, operational budget support | Mortality, educational losses, logistical gaps |
| 2022–2025 | Forced structural turn | New markets and calculations, defense-industrial loading, employment | Inflation, expensive capital, staffing deficit, infrastructure bottlenecks |
The Meaning of Transition
In 1990, the task was to stop the collapse of the payment circuit. In 2000, the main resource of growth was the utilization of already created capacities against the background of favorable export prices. By 2012–2013, this reserve was exhausted: further growth required new capital, technology, and productivity, not just demand.
After 2014, the stability of the exchange rate, banks and the budget has become more important than the speed of growth. This reduced the likelihood of a classic systemic crisis, but cemented the gap between fiscal prudence and real renewal. The period of 2022–2024 temporarily raised output due to strong state demand and full load factors; 2025 showed a limitation of this model - an increase of 1,0% under still tight monetary conditions.
3. Production, investment and productivity
Gross output has increased, but the structure of the sources of growth has changed. At the beginning of the 2000s, free capacities, cheap labor, strengthening of payment discipline and export demand simultaneously worked. In the 2020s, additional output increasingly requires scarce workers, expensive credit, parallel infrastructure, and technological replacement.
Figure 1. Annual real GDP rate, 1995–2025
Source: Rosstat, chain indices of the volume of GDP; 2024–2025 - current revisions as of the cut date.
Table 5. Changing the growth regime
| Interval | Changes in real GDP | Average annual rate | Mechanism |
|---|---|---|---|
| 1999–2008 | near +95% | about 6,9% | Recovery of loading, commodity cycle, growth of income and credit |
| 2009–2013 | near +17% | about 3,2% | Post-crisis recovery, then deceleration |
| 2014–2019 | near +6% | about 0,9% | Adaptation with weak investments and productivity |
| 2020–2025 | near +13% | about 2,0% | Pandemic failure, recovery and fiscal-industrial momentum |
Source: Rosstat: National Accounts
The investment gap
Nominal GDP has increased since 7,3 trillion Rubles in 2000 the Year 202,3 trillion Rubles in 2024 This is a combination of real growth, inflation and changes in price proportions. For the capital balance, the ratio of investments to disposal and the quality of new assets are more important. Average depreciation of fixed assets 42,3% in 2024 A significant portion of gross investment serves replacement, not net expansion.
Low unemployment no longer allows growth mainly through increased employment. A steady pace above 2% requires output growth per hour, downtime reduction, robotization, better management, and the movement of capital from low-performance to high-performance applications.
A balance trap occurs when a budget stimulates demand faster than capacity expands. Then the additional demand manifests itself in prices, imports or lengthening deadlines, and the central bank raises the cost of capital. It was this ligament that became visible in 2024–2025.
The problem is not the lack of aggregate demand as such, but the limited elasticity of supply: people, equipment, logistics and technology do not have time to respond to the impulse.
4. Budget, money and financial flows
The financial contour of Russia has become fundamentally more stable than the 1990s: public debt is small, banks are better capitalized, the exchange rate serves as a shock absorber. But in 2025, tensions shifted from solvency to the price of capital and the structure of sectoral flows.
Table 6. Financial Panel 2025
| Indicator 2025 | Value | Balance meaning |
|---|---|---|
| GDP growth | 1,0% | Cooling after high rates of 2023–2024 |
| Inflation, December by December | 5,59% | Above target but below peak pressure of 2024 |
| Average key rate | 19,2% | High cost of refinancing and investment |
| Key rate at the end of year | 16,0% | Beginning of mitigation while maintaining rigidity |
| Deficit of the federal budget | 5,645 trillion rub. | Demand supported by budget reserve reduction |
| Liquid part of the NWF at 01.01.2026 | 4,085 trillion rub. | Reserve is maintained, but its function becomes more selective |
| Public debt | about 15% GDP | Low level by international standards |
| International reserves at the end of the year | 754,9 billion Annex II USA | Gross stock is high, but some assets are limited; the growth of 2025 is largely due to the revaluation of gold |
Source: Bank of Russia; Minfin Russia. Values are rounded.
Sectoral Balances
Table 7. Financial accounts by sector, 2025
| Sector | Net lending (+) / borrowing (−) | % of GDP | Interpretation |
|---|---|---|---|
| Economy in general | +3,3 trillion rub. | +1,5% | The country remains a net creditor to the outside world |
| Households | +13,2 trillion rub. | +6,2% | Savings and financial reserve are high |
| Financial organizations | +2,5 trillion rub. | +1,2% | The financial sector accumulates resources |
| Non-financial corporations | −7,4 trillion rub. | −3,4% | Investments and working capital require financing |
| Public administration | −5,0 trillion rub. | −2,3% | Budget impulse compensates for part of private demand gap |
Source: Bank of Russia: financial accounts and balance sheets of financial assets
Household savings are a protective reserve, but their concentration on deposits does not guarantee conversion to long-term capital. This requires tools with understandable risk, inflation protection and binding to renewal projects.
Low public debt provides room for manoeuvre, but does not remove supply constraints. A loan is justified if it finances an asset with returns above the cost of service and does not fix fixed costs without a permanent source of income.
The monetary balance will remain tight as budget demand, wages and credit grow faster than capacity. Therefore, anti-inflationary policies should include not only the rate, but also the accelerated removal of physical bottlenecks.
5. External balance
The external contour remains one of the strongest: exports of goods exceed imports, the current account is positive, external debt is controlled. However, the quality of the balance sheet has changed - some reserve assets are limited, calculations and logistics are more expensive, the geography of trade is already, and the surplus of 2025 is less than the previous one.
Figure 2. Trade balance and current account, 2023–2025
Source: Bank of Russia, balance of payments estimate; USD billion Annex II
Table 8. Transformation of the external circuit
| Component | 1990 | 2000 | 2014–2021 | 2022–2025 |
|---|---|---|---|---|
| Currency regime | Vulnerable corridor and crisis | Managed strengthening | Floating rate and budget rule | Flow control and new design contours |
| Reserves | Inadequate | Rapid accumulation | High stock | High gross margin, but limited availability of some assets |
| Trade | Raw materials surplus | Price and volume increase | The Turn to Asia | Forced reorientation and increased logistics costs |
| Capital | Large outflow and debt | Accumulation of external assets | Delevering | Fragmentation of capital markets |
What hides the surplus
- A positive current account may reflect not only competitiveness, but also limited imports of equipment and services.
- The growth of external assets is not equal to the available reserve if the rights of disposal and settlement infrastructure change.
- Export earnings create sustainability only when they finance domestic accumulation of productive capital.
- Concentration on several products and markets increases sensitivity to price, discount, freight and sanction risk.
Not to maximize gross exports, but to increase net value per unit of resource: processing, service, intellectual component, reliability of calculations and diversification of routes.
6. The demographic balance
Demography is the contour with the longest lag and the least possibility of quick compensation. A child who is not born today will not enter the labor market in twenty years; a lost healthy life expectancy reduces the supply of labor right now. Therefore, the demographic deficit cannot be closed only by short-term migration.
Figure 3. Births and deaths, selected years 1995–2024
Source: Rosstat, natural population movement. Values are rounded; territorial changes require caution.
Table 9. Reference demographics
| Indicator | 1995 | 2000 | 2013 | 2019 | 2024/2025 | Trend |
|---|---|---|---|---|---|---|
| Population, million | 148,3 | 146,3 | 143,3 | 146,8 | 146,028 to 01.01.2025 | Decline; some broken by land change |
| Born, million | 1,36 | 1,27 | 1,90 | 1,48 | 1,22 (2024) | After 2015, steady decline |
| The dead, millions | 2,20 | 2,23 | 1,87 | 1,80 | 1,82 (2024) | Pandemic peak passed, but the gap remains |
| Total fertility rate | about 1,34 | about 1,20 | 1,71 | 1,50 | about 1,4 | Below simple reproduction |
| Life expectancy, years | 64,52 | 65,34 | 70,8 | 73,3 | 72,84 (2024) | Long-term growth with shocks |
Source: Rosstat: demography
Three different deficits
- Deficit of birth. Smaller generations enter reproductive age; even an increase in fertility per woman does not immediately increase the total number of births.
- Deficit of healthy years of life. Mortality of working age, chronic diseases and unequal access to prevention reduce the real supply of labor.
- Deficit of territorial consolidation. Young and skilled people are concentrated in the largest agglomerations, leaving the periphery with an aging structure and expensive infrastructure per capita.
What changes the trajectory
Cash payment by itself rarely overcomes the total barrier. The decision of the family depends on the availability of housing, stability of employment, kindergartens, medical care, time for care, transport accessibility and confidence in the future. The policy should be assessed at the full cost of the child’s birth and upbringing for the household.
Migration is necessary to smooth out the supply of labor, but its balance is determined not only by the number of arrivals. Important are age, qualifications, language skills, tax legalization, family integration and regional distribution. We need a selective long-term model, not just closing vacancies.
No economic scenario of 2035 is sustainable without a separate balance of population: birth, mortality, healthy life expectancy, migration and territorial permanence should be taken into account together.
7. Labor, income and human capital
The social result of the last 30 years is contradictory: mass poverty 1990 has sharply decreased, the real availability of goods and services has increased, unemployment has reached a historic low. At the same time, there was a shortage of workers, income inequality and access to quality services remain, and wage growth outpaces productivity in scarce segments.
Figure 4. Proportion of population below poverty line, years selected
Source: Rosstat. Since 2021, a new poverty line methodology has been applied; direct comparison requires a reservation.
Table 10. Human capital as flow, not expenditure
| Balance | Achievements | The new vulnerability | Monitoring indicator |
|---|---|---|---|
| Employment | Unemployment 2,2% in 2025 | Staff shortages, overloading and turnover | Vacancies, hours, productivity per hour |
| Revenues | Poverty reduction to 6,7% | Cost of living and median income gap | Median real disposable income |
| Health | OPG growth relative to 1990-x | Regional gap and chronic diseases | Healthy life expectancy and preventable mortality |
| Education | High coverage and digitalization | Deficit of engineering, workers and teachers | Employment by specialty, quality of skills |
| Housing and family | Record housing commissioning | Availability, mortgage load, infrastructure | Price/income, payment/income, places in social infrastructure |
Transition from Employment to Productivity
With almost full employment, additional output cannot be sustainably obtained through a constant lengthening of working hours. Organizational innovation, technology, retraining and mobility are needed. The critical indicator is not the number of employees by itself, but the output and quality per healthy working hour.
The education system should be assessed by the balance of competencies: how many specialists are trained, how many are entrenched in the profession and the region, how quickly the skills become obsolete, what is the demand of enterprises. Ordering without responsibility for employment generates a formal issue and a real deficit.
Poverty reduction is an important success, but the threshold is insufficient. For the reproduction of the family, the median income after mandatory payments, the cost of housing and childcare, the availability of medicine, as well as the household reserve in case of loss of income are important.
8. Industry, technology and science
The industrial circuit in 2022–2024 showed a high ability to mobilize and replace supplies. However, the loading of existing lines and the expansion of individual industries are not equal to technological reproduction. Its criterion is the ability to independently design, produce, maintain and next iteration to improve critical systems.
Figure 5. R&D staff and internal research costs
Source: Rosstat; NRU HSE according to Rosstat. Values for individual years are rounded.
Table 11. Ladder of technological reproduction
| Level | What is considered a stock | What is considered reproduction | Critical gap |
|---|---|---|---|
| Science | Schools, laboratories, researchers | Postgraduate studies, instrument base, publications and results | Staffing reduction and ageing infrastructure |
| Engineering | KB, standards, project competencies | Serial design and testing | Gap between prototype and series |
| Production | Lines, machine tools, tooling, suppliers | Updating equipment and quality | Components, machine tools, metrology |
| Market | Customers and sales channels | Long demand for domestic solutions | Pilots without scaling |
| Data and Software | Models, platforms, calculations | Update, cyber-resilience, feedback | Fragmentation and dependence on closed stacks |
V 2024 The internal costs of research and development, taking into account small businesses, were estimated at approximately 1,94 trillion rupees, or 0,97% GDP. This is significantly lower than the national benchmark of at least 2% GDP to 2030 year. Not only the amount, but also the share of entrepreneurial financing, competitiveness, measurable impact and sustainability of teams are important.
The number of domestic applications for inventions in 2024 increased to 41,4 thousand. A patent is an intermediate result. The balance sheet should track the share of developments that have reached the pilot, series, export and re-order.
Technological sovereignty should be interpreted as managed interdependence: critical functions should have domestic replacement and maintainability, and non-critical ones should be connected to global chains on a diversified basis.
Target 2030 No less than 2% GDP on R&D makes sense only together with an increase in the number of sustainable research teams, serial implementations and private co-financing. Otherwise, the consumption increases, but the system does not reproduce.
9. Energy and material balance
Russia has a large physical reserve and sustainable energy production. The restriction is not so much in the volume of raw materials, but in the cost of production, processing quality, logistics, equipment and environmental obligations. It is not gross tonnage that is important for the strategy, but the net value added per unit of extracted resource.
Figure 6. Index of physical output of oil, coal and electricity
Source: Rosstat; the Ministry of Energy of Russia. 1995 = 100; Values for 2025 Preliminary/operational year.
Table 12. Physical reference rows
| Indicator | 1995 | 2000 | 2008 | 2019 | 2025 | Balanced Output |
|---|---|---|---|---|---|---|
| Oil, million tons | about 307 | 324 | 488 | 561 | 511,5 | High level but below peak; recycling and markets are important |
| Coal, million tons | about 263 | 258 | 329 | 442 | about 440 | Growth rests on Eastern logistics and demand |
| Electricity, billion KW·h | about 860 | 877 | 1 040 | about 1 114 | 1 183,9 | Demand is growing; network and generating reserve is needed |
Source: Ministry of Energy of Russia: results of 2025
Five levels of resource efficiency
- recovery with minimal losses and accidents;
- depth of processing and product quality;
- energy efficiency of its own production;
- Logistic cost and market diversification;
- Closing the environmental obligation: recycling, reclamation, water and emissions.
Electricity is becoming the infrastructure of the new industrial cycle. Data centers, transport electrification, mining projects and new productions increase the load unevenly across territories. The overall power surplus can coexist with local network and connectivity deficits.
Material balance must take into account critical minerals and components. The presence of ore does not mean the presence of reagents, enrichment, clean materials, equipment and a certified final product. Therefore, the passports of chains are needed by functions, not only by types of raw materials.
10. Food, land and water
The agro-food circuit is one of the most notable adaptation successes. Grain yields, meat production, and food exports are well above the levels of the 1990s. But sustainability depends on seeds, breeding material, machinery, protections, soil fertility, water, and the transport chain.
Table 13. Food balance in dynamics
| Indicator | 1995 | 2000 | 2008 | 2022–2024 | Meaning |
|---|---|---|---|---|---|
| Grain, million tons | 63,4 | 65,4 | 108,2 | Mostly 126–158 | Export stock has increased, but the harvest is volatile |
| Meat | Deep decline in production | Beginning of recovery | Rapid growth of poultry and pork | Surplus by several categories | Import substitution has become systemic |
| Fish and aquatic bioresources | High natural potential | Export of raw materials | Fleet modernization has begun | Growth of processing is uneven | Need a great depth of processing |
| Land and soils | Large reserve area | Underinvestment | Intensification | Increased load and climate risks | Fertility is a slow capital |
Source: Rosstat: historical data on grain harvest
The new frontier of sustainability
Physical self-sufficiency does not close technological dependences. Seeds, genetics, veterinary medicines, agricultural machinery, software management and refrigeration logistics should be evaluated as part of the same chain.
Land is a renewable resource only when fertility is reproduced. The balance of humus, erosion, acidity, reclamation and return of organic matter should enter the project economy as well as fuel and fertilizer.
Water is a territorial resource, not a national average. The national runoff surplus does not exclude a shortage of quality water, pollution of the basin, or a lack of infrastructure in a specific production area.
Food exports are sustainable if domestic prices, soil quality, seed and machine circuits remain within the target range. Gross revenue should not be financed by the depletion of natural capital.
11. Infrastructure and housing
Infrastructure connects all other balances: without the network, industrial capacity is not realized, without transport - resource and food surplus, without utility systems - housing, without communication - territorial availability of services. Its main risk is the invisible gap between new construction and maintenance of the existing fund.
Table 14. Infrastructure balance of the life cycle
| Contour | Positive Flow | Accrued liability | Early warning indicator |
|---|---|---|---|
| Housing | 107,8 million m² entered in 2024 the Year | Availability, mortgage load, social facilities | Payment/revenue; introduction of networks 1 m² |
| Utilities | Modernization programs | High wear and loss | Accidents, loss of water and heat, replacement period |
| Railways | Growth of Eastern Transportation | bottlenecks of approaches and ports | Turnover time, transportation refusal, speed |
| Highways | New highways and repairs | Regional and municipal network | Normative share, life cycle cost |
| Power Grid | New connections | Local Deficit and Ageing | Connection period, SAIDI/SAIFI, loss |
| Digital network | About 90% households have access to the Internet | Quality and sustainability gap | Speed, fault tolerance, availability in small settlements |
Source: Rosstat: housing construction 2024
Average depreciation of fixed assets 42,3% in 2024 year - a signal that the volume of input cannot be estimated without disposal and repair. Every infrastructure program needs a full life cycle: construction, connection, operation, repair and dismantling.
Record housing starts do not guarantee a better housing balance if the price and mortgage payment grow faster than income, and new areas are not provided with jobs, schools, clinics and transport.
The eastern turn of trade enhances the strategic value of railways, ports, border crossings and the Northern Sea Route. But the choice of the project should take into account not only gross tonnage, but an increase in value added and reliability of the entire chain.
The new facility should be tested on four balances: demand for capacity, availability of personnel, maintenance cost and environmental liability. Otherwise, the input turns into a future budget deficit.
12. Territorial balance
The average in Russia hides several different economies: the largest agglomerations with a shortage of land and people; resource regions with high revenues and narrow specialization; old industrial areas with wear and tear; agricultural zones; small towns and remote settlements with high cost of basic services. The universal measure has a different effect.
Table 15. Different models of territorial balance
| Type of territory | Primary stock | The main deficit | Approach |
|---|---|---|---|
| Large agglomeration | People, markets, universities, capital | Housing, transport, time, ecology | Increasing density without loss of environmental quality |
| Resource region | Extraction and export revenue | Diversification, personnel, services | Chains localization and future generations fund |
| Old Industrial | Competences and infrastructure | Updating of funds and ecology | Reengineering of sites, clean production |
| Agrarian | Land, food, settlements | Revenues, processing, logistics | Recycling clusters and basic services |
| Small/remote | Territory, natural and cultural capital | Availability of services and connectivity | Support centers, mobile and digital services |
| Border/corridor | Logistics and Trading Position | Risks and capacity | Reliability of transitions, security, service |
From equalization of costs to equalization of opportunities
Inter-budget transfers hold the minimum level of services, but do not automatically create an economic base. The territorial balance should measure the availability of work, education, medicine, and transportation hubs in a reasonable time, not just per capita budget expenditures.
A reference point is effective if a real accessibility zone is formed around it. For each service, you need to choose a physical, mobile or digital form and take into account the reliability of communication, transport schedule and age structure of the population.
The decision on the location of production should be checked by the balance of water, energy, personnel, housing and logistics. The tax relief does not compensate for the systemic deficit of these five resources.
13. Ecology and climate
The ecological contour is often considered an external prohibition, although it is essentially a balance sheet of natural capital and future liabilities. Pollution, waste, soil degradation and climate damage first increase output through an unpaid resource, and then return through health, accidents, insurance, export barriers and fiscal reclamation.
Table 16. Environmental balance as a commitment
| Flow/stock | State | Why the average is misleading | What to consider |
|---|---|---|---|
| Waste | About 8,5 billion T in 2024 The year, mostly waste | Mass is not equal to toxicity, but shows the scale of material flow | Education, use, burial, accumulated object |
| Air | Decline in part of the cities, local hearths remain | Risk is concentrated by agglomerations and industrial nodes | Population exposure and days of excess |
| Water | Large national resource, uneven quality | Lack and pollution of swimming pools | Fence, Reset, Quality, Reuse |
| Forests | Largest stock, fires and illegal traffic | Area is not equal to absorption and quality | Growth, felling, death, recovery, carbon |
| Climate | Temperature rise above world average | The effects are different: permafrost, heat, fires, water | Damage to assets, adaptation, insurance coverage |
Source: Ministry of Natural Resources of Russia: state report
The circular economy
For mining and metallurgical chains, the main potential is the reuse of overburden, slag, ash, scrap metal and water. But recycling should not be a formal change in the waste code: you need a confirmed product, a market and no risk transfer.
For solid municipal waste, the priority is to prevent formation, separate collection, sorting, reuse and only then energy disposal or disposal. The target should not take into account the capacity of the facility, but the actual reduction of the burial.
Adaptation to climate change is no longer a distant future. Permafrost infrastructure, southern agriculture, forest regions and large cities need physical risk maps included in the cost of capital and insurance.
The natural resource balance is not free. If restoration, monitoring and future liquidation are not included in the project price, the system accumulates environmental debt outside the balance sheet.
14. Integrated matrix
The matrix reduces 13 contours to a single logic. Green status means that the stock and current flow are generally stable; yellow - the stock is still sufficient, but reproduction is weakening; orange - negative flow requires a reversal of policy; red - the deficit already limits other contours. The assessment is expert and is intended for prioritization, not for statistical ranking.
Figure 7. Expert map of national balances by stages
Source: synthesis of official data of Rosstat, the Bank of Russia, the Ministry of Finance, the Ministry of Energy and the Ministry of Environment. Not an official index.
Table 17. Imbalance Transmission Channels
| Causal ligament | Primary Deficit | Transmission | The final effect |
|---|---|---|---|
| Demography → labor → inflation | Few employees and healthy hours | Salaries are growing faster than release | Increased costs and a hard rate |
| Rate → investments → funds | Expensive long capital | Postponement of updates and repairs | Wear, accidents, poor performance |
| Technology → import → external account | No component/service | Costly round-trip imports | Reduction of net export rent |
| Infrastructure → area → demographics | No availability of services and market | The outflow of youth | Aging and rising costs of services |
| Ecology → health → work | Pollution and climate risk | Diseases, downtime, damage to assets | Reduction of output and budget growth |
Major inconsistencies 2025
- Household financial savings are large, but long production capital is expensive.
- Unemployment is minimal, but productivity and automation do not close the personnel gap.
- The external surplus remains, but access to technological imports and part of the assets is limited.
- Housing is record-breaking, but the family’s demographic decision depends on affordability and infrastructure, not meters on average.
- Resource output is high, but recycling, logistics, and environmental closure determine net worth.
- Public debt is low, but the hidden obligation of worn-out funds is great.
15. Scripts 2026–2035
Scenarios are not forecasts. These are three logically agreed upon sets of solutions and consequences. The real trajectory can combine their elements, but the choice of priorities should be clear: what stocks are spent, what flows are strengthened and what commitments are made.
Table 18. Scenario fork
| Parameter | A. Inertial adaptation | B. Investment Mobilization | B. Regenerative balance |
|---|---|---|---|
| Logic | Preserve current institutions and respond to shocks | Accelerate the release through a large state order | Linking investment to the reproduction of people, capital and ecosystems |
| Growth | About 1–2% on average | Higher at the beginning, then the risk of overheating | 2,5–3,5% as a target corridor for productivity growth |
| Inflation/rate | Slow decline | Pressure due to supply constraints | Reduction through capacity expansion and demand coordination |
| Demography | Continuation of natural loss | Work is replaced by migration and workload | Family infrastructure, health, selective migration |
| Capital | Wear is reduced slowly | Quick entry, risk of expensive maintenance | Life cycle, performance and maintainability |
| Technology | Point import substitution | Priority of critical industries | Platforms, serialization, private co-financing, export |
| Ecology | Post-facto compensation | Risk of secondary environmental objectives | Commitment included in project and capital price |
| The main risk | Slow depletion of stock | Inflation and ineffective capex | Difficulty coordinating and measuring results |
Target corridors of scenario B
Table 19. Management guidelines, not a point forecast
| Indicator | Base | Reference 2030 | Reference 2035 | Condition |
|---|---|---|---|---|
| Real GDP | +1,0% in 2025 | 2,5–3,5% per year | not less than 3% trending | Productivity and investment without overheating |
| Inflation | 5,59% Dec/Dec | about 4% | about 4% | Harmonization of budget and supply capacity |
| R & D | 0,97% GDP in 2024 | not less than 2% GDP | 2,5% GDP | Growth of teams, private funding and implementation |
| Depreciation of fixed assets | 42,3% to 2024 | Below 40% | 35–38% | Disposal and repair are considered together with the input |
| Poverty | 6,7% to 2025 | Below 7% | Below 5% | Median income and targeting |
| OPG | about 73 years | 78 years | 79–80 years | Healthy years and prevention |
| TFR | about 1,4 | 1,6 | 1,7+ | Full family infrastructure |
Source: Decree of the President of the Russian Federation No. 309 from 07.05.2024 and expert corridors
Triggers of revision
- Inflation is consistently higher 6% With a lower output growth 2% — Lack of supply, not just demand.
- The liquid part of the reserves covers less than two years of stress deficit - a prioritization of obligations is required.
- Investments are growing, and depreciation is not reduced for three years - input does not compensate for disposal or the quality of accounting is not enough.
- The number of births and healthy life expectancy at the same time worsens two years - demographic policy is transferred to the priority program.
- The share of serial implementations does not grow with an increase in R&D - financing is redistributed from the process to a proven transition to production.
16. Strategic agenda
We do not need another sum of sectoral programs, but a mechanism for coordinating balance sheets. Each major measure should show what stock it creates, what flow changes, what commitment it makes and what neighboring contour can limit the result.
Table 20. Portfolio of priority decisions
| Priority | Judgement 2026–2028 | Key result | Horizon |
|---|---|---|---|
| 1. Unified system of balances | National Register of Stocks, Flows and Obligations with Data Passports | Quarterly Early Warning Panel | 12–18 months |
| 2. Demographic reproduction | Package "Housing + care + health + time + employment" by family type | Reducing the full cost of birth and upbringing | 3–10 years |
| 3. Productivity | Automation and Organizational Transformation Fund for SMEs and Industry | Release by one hour and release of scarce labor | 2–5 years |
| 4. Fixed capital | Life cycle passports of networks and production assets | Decreases with input | 3–10 years |
| 5. Technology Chains | Maps of critical functions: design-component-service-series | Serial repairable domestic function | 2–8 years |
| 6. Long Money | Savings tools tied to proven infrastructure and industrial projects | Some of the excess liquidity becomes capital | 2–5 years |
| 7. Territorial connectivity | Standards for accessibility of services and reference centres | Reducing forced migration and access time | 3–8 years |
| 8. Environmental closure | Reserving the cost of liquidation and restoration in the project | Reduction of accumulated environmental debt | 2–10 years |
Digital contour "EQUILIBRIUM - Balances of Russia"
The digital system should not be a showcase of indicators, but a decision-checking machine. Its core is a linked graph of stocks, flows, constraints and liabilities, where each value has a source, date, methodology and level of uncertainty.
The first pilot should be built on three end-to-end chains: “demography-labor-housing”, “investments-funds-energy network” and “resources-refining-logistics-ecological closure”. They cover the main human, capital and natural obligation deficits.
Table 21. Digital contour architecture
| Module | Function | Withdrawal |
|---|---|---|
| DATA | Versioning of official series, breaks of methods and territories | Checked passport indicator |
| BALANCE | Calculation of reserves, inflows, disposals, reserves and liabilities | Balance and time to threshold |
| STRESS | Shock prices, rates, demography, logistics and climate | Vulnerability and Cascade Map |
| SCENARIO | Comparison of solution packages and lags | Result corridor and error price |
| PORTFOLIO | Prioritization of projects on several balances | Priority, funding, benchmarks |
| AUDIT | Fixing source, assumption, owner and revision | Decision trail and independent verification |
Integration Pilot Projects ECO-PPA the " World Cup "SPECZASHCHITA" can be connected as application contours of verification of environmental obligation, power supply and security of critical infrastructure - after unification of indicators and rules of verification.
Organizational model
- a small methodology centre responsible for definitions, data quality and inter-contour linkages;
- owners of each balance in the relevant departments and development institutions;
- an independent scientific and expert board to verify assumptions and scenarios;
- open layer of aggregated data and protected layer of project/sensitive information;
- Annual national report and quarterly panel of early signals.
Conclusion
Over thirty years, Russia has created what it lacked in the 1990s: the state’s ability to meet its payment obligations, a reserve framework, competitive export industries, a food production base, low unemployment and the capacity to adapt institutions rapidly. This is a real stock of resilience.
But the next task is another type. A currency reserve does not replace a child, an engineering school, a good network, fertile soil, or serial technology. These assets are reproduced slowly, require harmonization and do not arise automatically from the current surplus.
Therefore, the criterion of success of 2026–2035 years is not a maximum of a single indicator, but joint sustainability: growth without accelerating inflation; employment without depletion of people; exports without technological impoverishment; construction without accumulation of wear and tear; extraction without environmental debt; territory without forced outflow.
The main managerial transition is from reaction to deficits to reproduction design. The national balance sheet should become a constant cycle: measure the stock, see the flow, check the limit, select the portfolio, fix the obligation and revise the decision on the fact.
Final formula of sovereignty XXI The ability to not only withstand the shock, but also to reproduce people, knowledge, capital, infrastructure and the natural environment faster than they leave.
Annex A. Passports of indicators
Below is the minimum set for the working panel. Each indicator should be stored with a version, territory, unit, frequency, source, revision technique and uncertainty interval.
Table A1. Minimum passports 13 balance sheets
| Contour | Stock | Stream | Stress indicator | Target corridor |
|---|---|---|---|---|
| Demography | Number, age, healthy OPG | Births, deaths, migration | SCR; natural balance | TFR ≥1,6; OPG 78 |
| Human capital | Healthy years, competences | Release, retraining, loss of skills | Preventable mortality; employment | Growth of healthy OPG; >75% Fixation |
| Work and income | Labour force, household reserves | Hours, Salaries, Taxes, Transfers | Productivity/hour; median income | Productivity ≥2%/year |
| Macroeconomics | Production capital | Release, investment, disposal | Potential growth; output gap | Trend 2,5–3,5% |
| Budget and Debt | FNB, tax base, debt | Income, expenditure, borrowing | Structural surplus; maintenance | Debt <25% GDP; sustainable primary balance sheet |
| Money and Finance | Savings, capital of banks | Credit, interest, defaults | Real rate; long loan | Inflation about 4% |
| External | Reserves, external assets/debt | Exports, imports, revenues, capital | Available reserve; concentration | Positive account without capital import compression |
| Technology | Teams, patents, platforms, equipment | R&D, Pilots, Series | Series/pilot; private co-financing | R&D ≥2% GDP |
| Energy and materials | Stocks, capacities, networks | Production, processing, losses | Value added/t; network reserve | Reducing energy intensity ≥2%/year |
| Food | Soils, seeds, herds, capacities | Crops, consumption, exports | Self-sustainment; humus balance | Surplus without soil degradation |
| Infrastructure | Network and asset status | Input, repair, accident, disposal | Depreciation; life cycle cost | Depreciation <40% C 2030 |
| Territories | People, centers, natural capital | Migration, investment, accessibility | Time to service; outflow of youth | Reducing the Accessibility Gap |
| Ecology | Water, forest, soil, accumulated damage | Emissions, discharges, waste, recovery | Exposure; secondary; damage | Reduction of burial and damage |
Passport model of a separate indicator
Table A2. Data quality standard
| Field | Mandatory content |
|---|---|
| Title and meaning | What is measured and what decision changes |
| Formula | Numerator, denominator, deflator, seasonality, sign |
| Unit and territory | Roubles current/permanent, physical unit, boundaries of territory |
| Source and Version | Office, publication, date of download, date of revision |
| Frequency and lag | Month/quarter/year; delayed publication |
| Breaks of a series | Classifier, methodology, census, territory |
| Corridor | Normal, tensile, critical ranges |
| Owner of the reaction | Who is obliged to explain the deviation and propose an action |
Annex B. Methodological reservations
Table B1. Where Caution is Especially Important
| Area | Reservation |
|---|---|
| National accounts | Rosstat regularly reviews GDP and its components; the values of 2023–2025 may differ from early publications. Chain indices are used for the rates, not the ratio of nominal volumes. |
| Prices | Inflation at December by December is different from the annual average. The rate at the end of the year is different from the average rate for the year. |
| Territory | Comparability of population, GRP and industry ranks is violated by changes in the composition of the territory and completeness of accounting. Long graphs are used to guide a trend, not an exact decomposition. |
| Demography | Census results and administrative records may review population levels. Birth rates depend on the age structure of women. |
| Poverty | Since 2021, the poverty line has been calculated according to a new methodology; a methodological gap is noted in the graph. |
| Workforce | The age range of employment surveys and classifications has changed. Record-low unemployment does not measure hidden skills deficits. |
| Fixed assets | The degree of wear is an accounting indicator; it is not equal to physical accident but is useful as an early indicator. |
| External sector | After 2022, the detail of trade and cross-border transactions is limited; balance of payments data are evaluated and revised. |
| Science | R&D and personnel costs depend on the coverage of the organizations; GDP share does not reflect quality and commercialization. |
| Ecology | The mass of waste is dominated by mining and class V; joint hazard, accumulation and exposure assessment is required for risk. |
| Synthetic matrix | Color status - expert classification based on the direction of the stock, flow and reproduction. It is not an official rating. |
Sources
The basis is official publications. Links lead to the pages of departments or files available on the cut date. The data in the text is rounded; if there is a discrepancy, the latest version of the source source takes precedence.
1. Rosstat. National accounts
2. Rosstat. "Intelligible statistics": GDP and accounts
3. Rosstat. Russian Statistical Yearbook
4. Rosstat. "Russia in numbers - 2025"
5. Rosstat. Prices and inflation
6. Rosstat. Demography
7. Rosstat. Historical population
8. Rosstat. Natural population movement, 2024
9. Rosstat. Poverty, preliminary estimate 2025
10. Rosstat. A number of historical poverty
11. Bank of Russia. Balance of payments
12. Bank of Russia. Balance of payments of Russia, 2025
13. Bank of Russia. International reserves
14. Bank of Russia. External debt
15. Bank of Russia. Financial accounts and balances
16. Bank of Russia. Macroeconomic Review, January 2026
17. Minfin Russia. Preliminary execution of the federal budget for 2025
18. Minfin Russia. the National Welfare Fund
19. Minfin Russia. Public debt and debt policy
20. Minfin Russia. Budget forecast up to 2042
21. Rosstat. Science, innovation and technology
22. ISSEZ NIU HSE. R & D expenditure in 2024
23. ISSEZ NIU HSE. Staff and researchers, 2024
24. Rosstat. Historical number of R&D personnel
25. Rospatent. Applications for Inventions 2024
26. Rosstat. Fixed assets
27. Rosstat. Housing construction in 2024
28. Ministry of Energy of Russia. Results of activity for the year 2025
29. Rosstat. Historical range of grain harvest
30. Ministry of Natural Resources of Russia. State report on the state of the environment
31. Rosstat. Environmental protection
32. Ministry of Transport of Russia. Implementation of the Transport Strategy
33. President of Russia. Decree No. 309 on national objectives
End of document
Source materials
Originals and versions of the document
- Analiz_natsionalnyh_balansov_Rossii_1995-2025.docxDOCX · main document
- Analiz_balansov_Rossii_1995-2025.pptxPPTX · related version
Other editions in web format
Each version is disclosed separately; the sequence of the source document is saved.
Russia's balance sheets: from the stock of stability to reproductionAnaliz_balansov_Rossii_1995-2025.pptx · web text+
YEARS
STRONG STOCK
1995–2025 • Solutions 2026–2035
STRONG FLOW
System diagnostics of stocks, flows,
Reproduction and Sustainability
Main question 2035:
What is Russia capable of sustainably reproducing?
Prepared for Sokolov Sergey Leonidovich
Moscow • 2026
≈15% GDP
ANALYTICAL CONCLUSION
Strong stocks - intense reproduction
For 30 years, Russia has closed the deficit of basic payment stability. The new deficit is the ability to renew people, knowledge and basic capital.
ESTABLISHED STABILITY STOCKPILING
Narrow Places of Reproduction
$754,9 billion
1,22 million
42,3%
Public debt
International Reserves
Births in the year 2024
Average depreciation of funds
+$113,2 billion
126–158 mln t
0,97% GDP
676 thousand.
Balance of goods 2025
grain harvest in 2022–2024
R & D costs
R&D staff
The main transition is not to spend stocks, but to turn them into productivity, human capital and a long life cycle of assets.
Each era created the next deficit.
ANALYTICAL CONCLUSION
Thirty years is not a single series, but six regimes with different logics of growth and sustainability.
1995–1999
2000–2008
2009–2013
2014–2019
2020–2021
2022–2025
Liquidity
Rise
Stabilisation
Sovereign
Outline
Pandemic
Structural Turn
Stopped the breakdown of payments
Income and reserves
Banks and employment
Course and import substitution
Digital services
New Markets and Loading
poverty • debt • wear
raw material concentration
the Impact Plateau
investment pause
Mortality • skills
Frames • Rate • Networks
Renovated
Accumulated as a risk
By 2012–2013, the reserve of reloading old capacities had exhausted: further growth requires new capital, technology and productivity.
13 balance sheets: strong shields, weak reproduction
EXPERT DIAGNOSTICS
Color status is an expert classification of the direction of stock, flow and reproduction. This is not an official government index.
Growth has stalled in supply constraints
FACT
KEY SIGNALS
average annual growth 1999–2008
average annual growth 2014–2019
growth in 2025
Growth constraints have shifted from demand to supply: people, equipment, logistics, and technology are scarce.
19,2%
FACT
Savings don’t turn into long capital
Net lending/borrowing sectors in 2025 the Year, trillion roubles
TRANSITION PRICE
Nefin. companies
Public sector
average key rate of 2025
+6,2% GDP
Household balance
−3,4% GDP
Balance of non-financial companies
There is a financial reserve; the bottleneck is the projects being tested, the long horizon and the cost of capital.
External surplus is maintained, but its stock is narrowing
FACT
KEY SIGNALS
+$113,2
billion — balance sheet 2025
+$38,8
billion — current account 2025
current account reduction to 2024
The surplus protects against the classical payment crisis, but does not remove the restrictions of settlements, logistics and technological imports.
Demography has become the main systemic deficit
FACT
KEY SIGNALS
1,22 million
Births in the year 2024
1,82 million
Deaths in the year 2024
Total fertility rate
Demography transfers the restriction further: labor → costs → inflation → rate → investment.
Social progress has reached the labor ceiling
FACT
KEY SIGNALS
29,0%
poverty in the year 2000
preliminary estimate 2025
Unemployment: the labor reserve is exhausted
The next criterion of social balance is not only income, but healthy years, skills, family stability and consolidation of personnel.
The scientific contour has lost scale and seriality
FACT
KEY SIGNALS
R&D staff: 1,061 million → 676 thousands.
0,97%
R&D expenditure to GDP of 2024
41,4 thousand.
Russian Applications for Inventions
The main technological gap is not between the idea and the patent, but between the prototype, series, service and re-order.
Resource surplus requires more added value
FACT
KEY SIGNALS
511,5 mln t
oil in the year 2025
≈440 million tons
coal in 2025
1 183,9
billion kW·h electricity
Physical surpluses become strategic only after recycling, sustainable logistics, and environmental closure.
107,8 million m²
FACT
New entry does not replace asset life cycle
The infrastructure balance should count the input, connection, operation, repair and disposal as one chain.
42,3%
Housing construction in the year 2024
average depreciation of fixed assets
Physical input ≠ Accessibility of housing, networks, transport and services.
Accounting depreciation is an early indicator of liability, but not a direct prediction of failure.
ENTER
CONNECTION
EXPLOITATION
REPAIR
ELECTION
Investment filter: water • energy • frames • housing • logistics • maintenance cost.
Environmental debt is returned through health and budget
FACT
UNENTIFIED COMMITMENT
Today
Production • issue • revenue
billion tons of waste
Accumulation
Waste • Emissions • Degradation
formed in 2024; the bulk is associated with mining
Return
health • downtime • accident • insurance
Payer
enterprise • territory • budget • future generations
Mass ≠ toxicity: in the pilot it is necessary to divide the hazard class, accumulation and exposure of the population.
If monitoring, recovery and liquidation are not included in the project price, the system accumulates debt outside the balance sheet.
Imbalances reinforce each other with a cascade
ANALYTICAL HYPOTHESIS
Causal chains are hypotheses for stress testing, not already proven econometric coefficients.
DEMOGRAPHY
WORK
COSTS
INFLATION
RATE
INVESTMENTS
IZNOS
PRODUCTION
INFRASTRUCTURE
AVAILABILITY
OTTOK
DEMOGRAPHY
Industry KPI optimizes one link. The national balance checks the entire cascade, lags and neighboring constraints.
2,5–3,5%
Scenario analysis
Until 2035, there are three different trajectories
Scenarios are not forecasts. These are logically consistent sets of solutions, consequences and risks.
Inertial adaptation
Investment Mobilization
Regenerative balance
quick start
target growth rate
Speed depends on removing bottlenecks
target growth rate
Respond to shocks within existing institutions
Accelerate the release of a large state order
Linking investment to the reproduction of people, capital and ecosystems
RISK: Slow depletion of stock
RISK: inflation and inefficient capex
RISK: Difficulty in coordination and measurement
Recommended frame
78 years
TARGET ORIENTORS
The goal is a corridor of joint sustainability
Official purposes 2030 years separated from expert guidance 2035 years.
OFFICIAL GOALS 2030
EXPERT CORRIDOR 2035
35–38%
≥2% GDP
Trending GDP growth
inflation
Depreciation of funds
Life expectancy
Internal R&D costs
poverty
TFR
The benchmark is considered to be achieved only jointly: growth without accelerating inflation, employment without exhausting people, input without increasing hidden obligations.
Decisions must take into account different lags
PROJECT OFFER
Fast tools create measurability; medium-term tools create productivity; long tools create reproduction of people, funds, and territories.
12–18 MONTH
2–5 YEARS
3–10 YEARS
Unified Balance Register
Automation and productivity
Family infrastructure and health
Data Passports and Methods
Long money for verified projects
Fixed asset life cycle
Early warning panel
Critical technology chains
Territorial connectivity
Environmental closure
Portfolio Rule: Each measure shows the stock being created, the changeable flow, the commitment being made, and the adjacent constraint.
EQUILIBRIUM: Decision checking machine
PROJECT OFFER
Not a new window of statistics: the sources remain with the data owners; the circuit connects the balances, stress tests the solutions and keeps the verification trail.
DATA
BALANCE
STRESS
SCENARIO
PORTFOLIO
AUDIT
Passport
Indicators
Balance and
Time to threshold
Cascade
Vulnerability
Corridor
Results
Priority
projects
The decision followed and
verification
OPEN SLAY
PROTECTED SLAY
aggregated indicators • methods • version • national report
design data • scenarios • sensitive infrastructure • access control
Prior to launch, an integration scheme with EMISS, GAS "Management" and departmental GIS is required - without duplicating owners and functions.
Three pilots will prove the value of the system
PILOT HYPOTHESIS
The horizon is 12–18 months: three cross-industry chains, a single methodology and a verifiable management result.
DEMOGRAPHY → LAB → HOUSING
PILOT EXIT
Cost of family sustainability
Data Passports
basic balances and thresholds
INVESTMENTS → FUNDS → ENERGY SETS
input minus disposal and maintenance
Stress test of three chains
the Quarter Panel
RESOURCE → PROCESSING → LOGISTICS
Independent verification report
Environmental closure
ECO‑PPA the " World Cup "SPECZASHCHITA" - possible application contours only after unification of indicators, legal regime and independent verification.
A decision is required to launch the pilot
DECISION FOR CONSIDERATION
Approve Methodical Framework
CRITERIA OF SUCCESS
Stock • Flow • Reproduction • Commitment
The portfolio decision changes based on the associated balance, and the effect is confirmed by an independent check.
Appointing a State Employer
Data Owners • Scientific Council • Independent Validator
90 days to collect the basic contour
Passports indicators • three chains • integration card
TO START DURING
Legal format
After 12 months to make a decision
Budget and source of funding
scale, adjust or stop by verifiable KPI
Integration with state GIS
Access and Cyber Protection Mode
Sovereignty XXI centuries - reproduce people, knowledge, capital, infrastructure and the natural environment faster than they are eliminated.
Sources indicated in the presentation 27
- Original synthesis of the strategic report.
- Bank of Russia — international reserves: https://www.cbr.ru/statistics/macro_itm/external_sector/ir/
- Ministry of Finance of Russia — public debt and the National Security Fund: https://minfin.gov.ru/ru/press-center/
- Rosstat — demography and fixed assets: https://rosstat.gov.ru/folder/12781; https://rosstat.gov.ru/folder/14304
- ISSEZ HSE according to Rosstat — R & D 2024: https://issek.hse.ru/news/1105778603.html
- Rosstat — national accounts: https://rosstat.gov.ru/statistics/accounts
- Bank of Russia — macroeconomic statistics: https://www.cbr.ru/statistics/
- Synthesis of official data of Rosstat, the Bank of Russia, the Ministry of Finance, the Ministry of Energy and the Ministry of Natural Resources; initial report, figure 7.
- Bank of Russia — financial accounts and balances: https://www.cbr.ru/statistics/macro_itm/fafbs/financial_accounts/
- Bank of Russia - Macroeconomic Review, January 2026: https://www.cbr.ru/Queries/XsltBlock/File/87500/-1/2601
- Bank of Russia — Russia’s balance of payments, 2025: https://cbr.ru/Collection/Collection/File/62277/Balance_of_Payments_2026-2_27.pdf
- Rosstat - the natural movement of the population, 2024: https://rosstat.gov.ru/folder/313/document/255130
- Rosstat — demography: https://rosstat.gov.ru/folder/12781
- Rosstat — historical poverty line: https://rosstat.gov.ru/bgd/regl/b11_14p/IssWWW.exe/Stg/d01/05-11.htm
- Rosstat - preliminary poverty assessment 2025: https://rosstat.gov.ru/storage/mediabank/33_13-03-2026.html
- Bank of Russia — Macroeconomic Review: https://www.cbr.ru/Queries/XsltBlock/File/87500/-1/2601
- Rosstat — historical range of R&D personnel: https://rosstat.gov.ru/bgd/regl/B01_57/IssWWW.exe/Stg/d010/i010010r.htm
- ISSEZ HSE - R & D 2024: https://issek.hse.ru/news/1105778603.html
- Rospatent — applications for inventions 2024: https://rospatent.gov.ru/ru/news/20-02-2025-kolichestvo-rossiyskih-zayavok-na-registraciyu-izobreteniy-vyroslo-na-9-4
- Russian Ministry of Energy — performance results for 2025: https://minenergo.gov.ru/upload/iblock/24f/w5di5x0ijq6p6wjy4haccvptagofymwr/Prezentatsia_Kollegia_Minenergo.pdf
- Rosstat — grain harvest: https://rosstat.gov.ru/bgd/regl/b11_38/IssWWW.exe/Stg/04-07.htm
- Rosstat — housing construction, 2024: https://rosstat.gov.ru/storage/mediabank/jil_stroi_2024.doc
- Rosstat — fixed assets: https://rosstat.gov.ru/folder/14304
- Ministry of Natural Resources of Russia — state report: https://gosdoklad.mnr.gov.ru/
- Rosstat — environmental protection: https://rosstat.gov.ru/compendium/document/13295
- Analytical synthesis of the initial report, table 17; official ranks of Rosstat and the Bank of Russia.
- Decree of the President of the Russian Federation No309 of 07.05.2024: https://www.kremlin.ru/acts/bank/50542