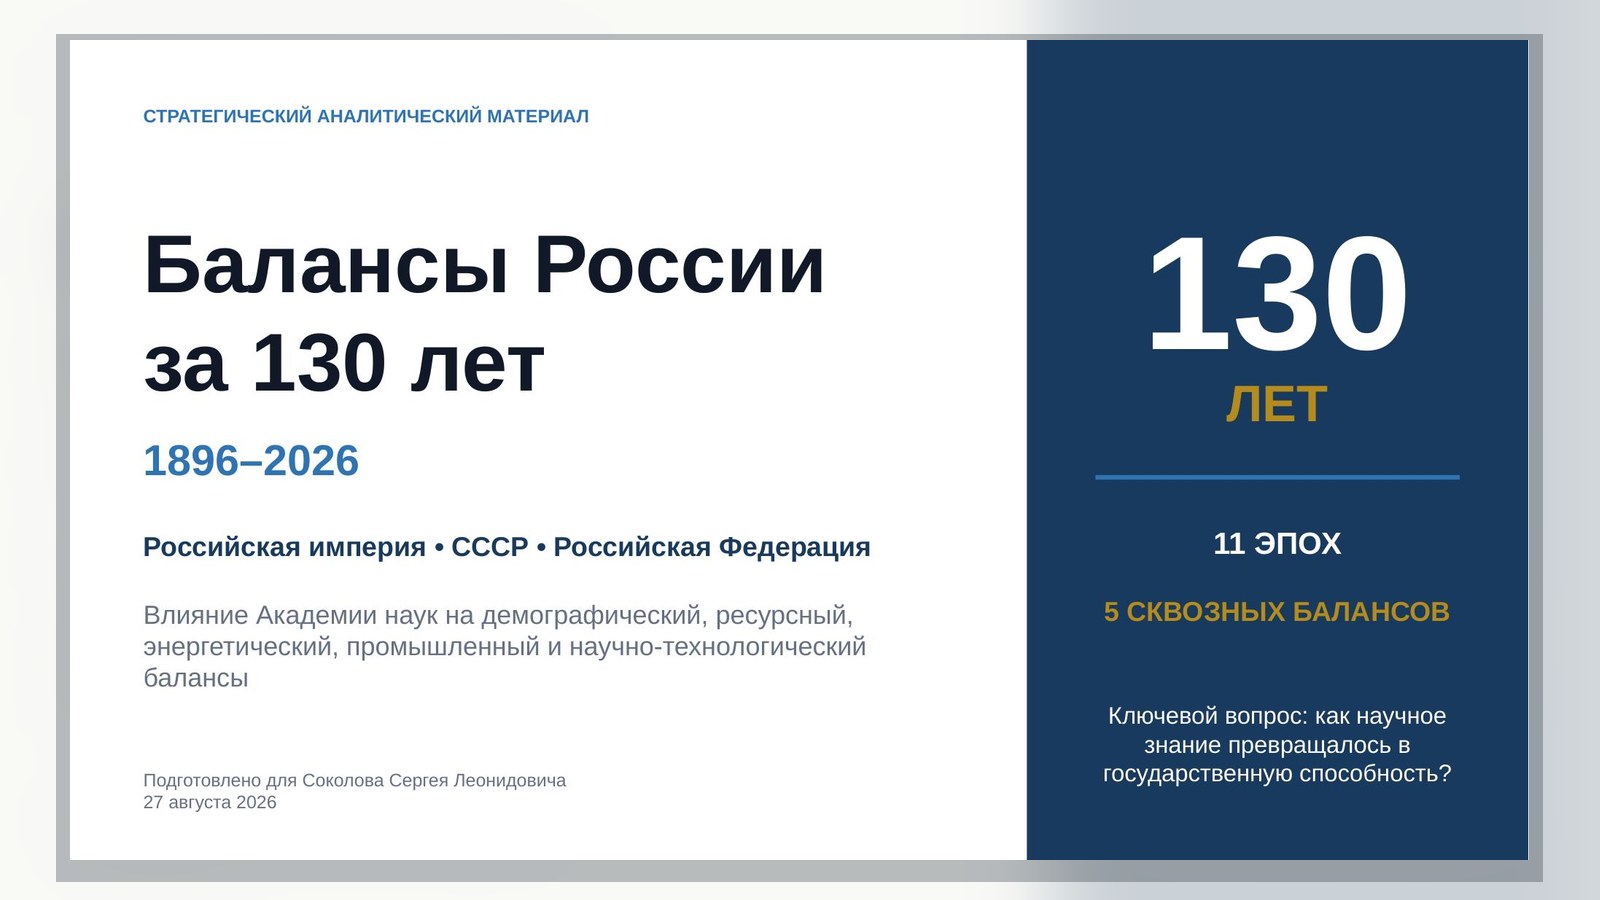
Brief annotation
About the document
A historical review of Russia’s balances in relation to the role of academic science and systems planning.
Balansy_Rossii_1896-2026_Akademiya_nauk.pptx
Downloading the document...
Russian Empire • USSR • Russian Federation
The influence of the Academy of Sciences on the demographic, resource, energy, industrial and scientific-technological balance
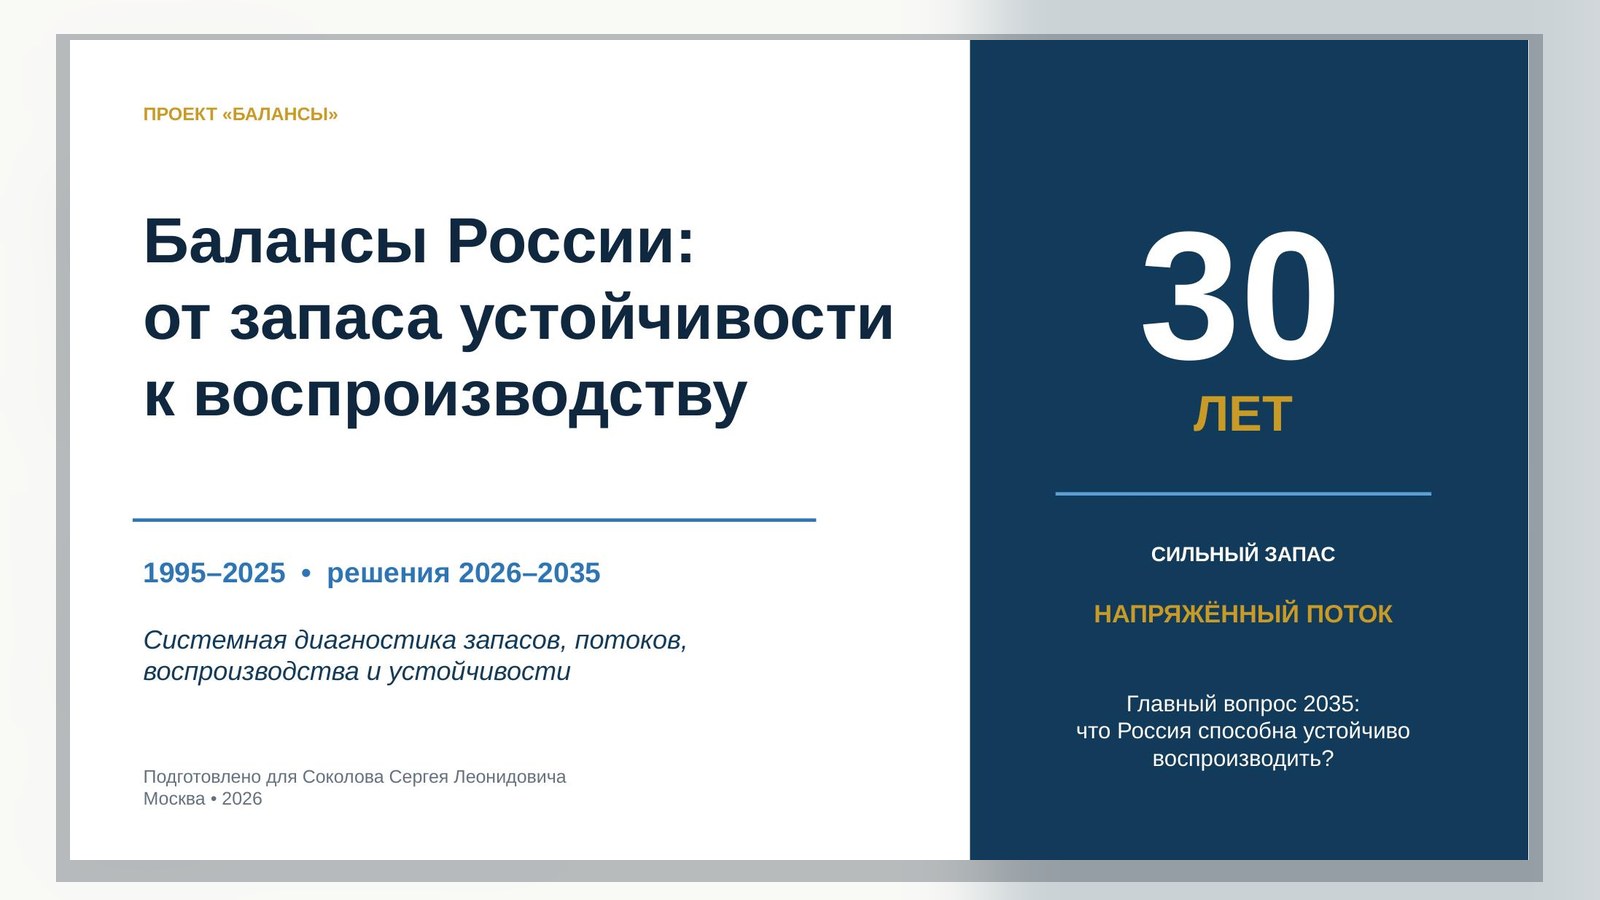
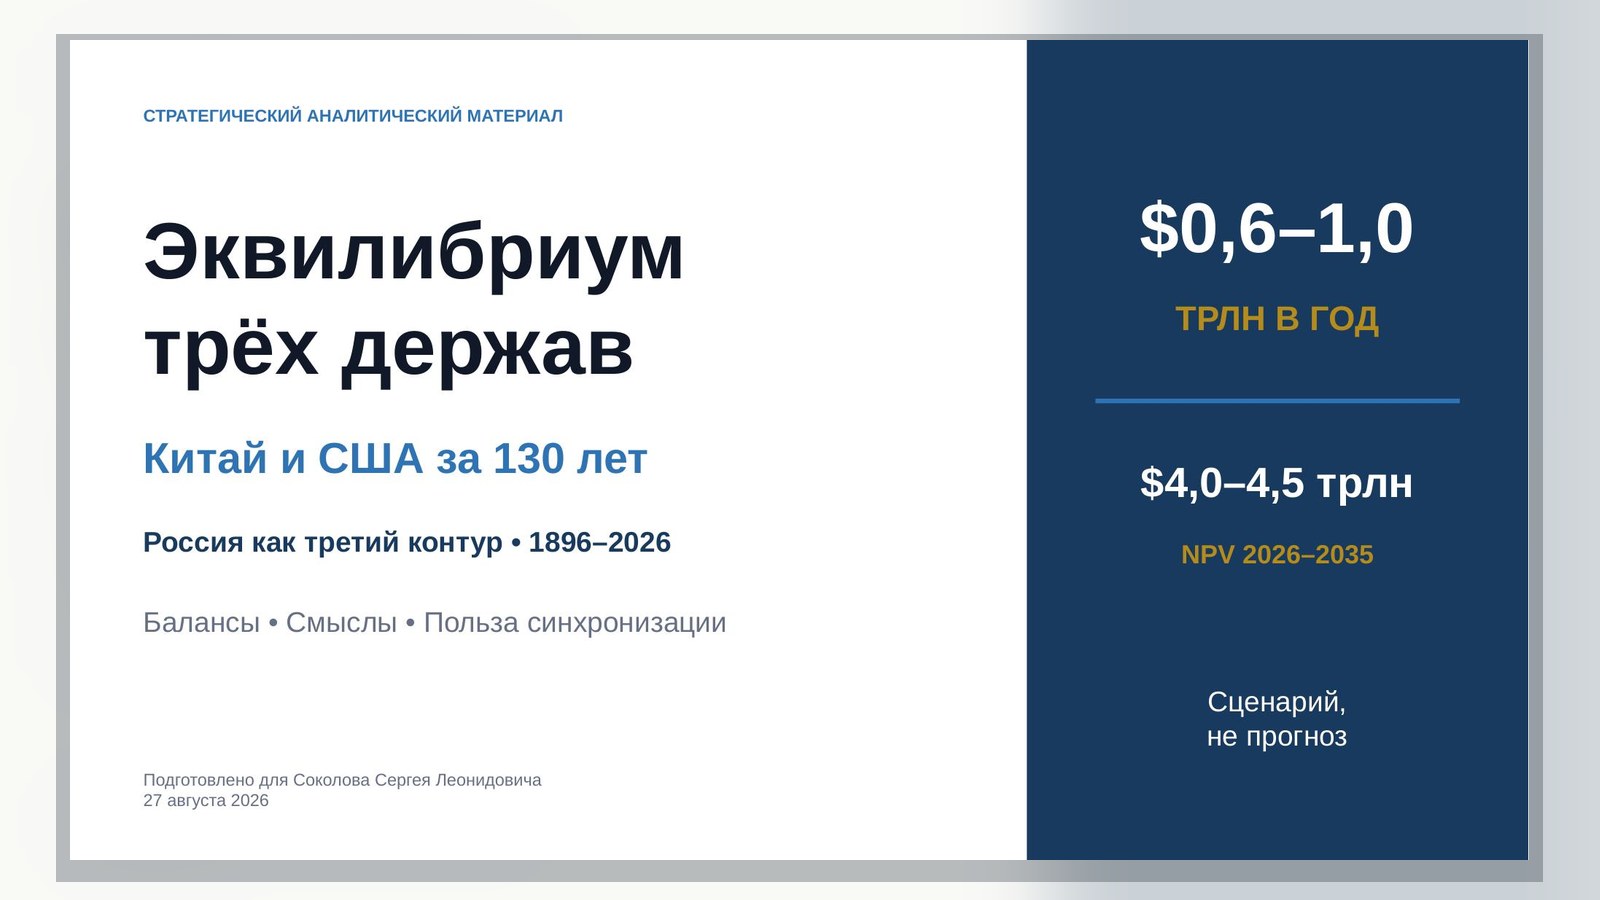
Prepared for Sokolov Sergey Leonidovich
Version 1.0 • 27 August 2026
Table of contents
| Section | Page |
|---|---|
| Summary for decision | 3 |
| Methodology: how to read 130-year-old series | 4 |
| Map of 11 epochs | 5 |
| The Russian Empire, War and NEP: The Epochs of 1–3 | 6–10 |
| USSR: Industrialization, War, Reconstruction, Maturity and Restructuring — Ages 4–8 | 11–19 |
| Russian Federation: epochs 9–11 | 20–25 |
| Five through balances | 26–30 |
| Influence and limits of the Academy of Sciences | 31–32 |
| Academic Register and Road Map | 33–34 |
| Annexes and sources | 35–39 |
All figures are provided with the indication of the territory and source; roundings are indicated by the sign ≈.
Summary for decision
| Shift | 1897 / 1913 | The Soviet maximum | RF: the last point | What it means |
|---|---|---|---|---|
| Urbanization | 13,4% the Empire; ≈15% the Russian Federation | 73% in RSFSR, 1989 | about 75%, 2025 | The country has become urban; the deficit has shifted from basic infrastructure to environmental quality and human resources. |
| Electricity | ≈1,94 billion KW·h, 1913 | 1 705 billion KW·h, USSR, 1988 | ·h 1 183,9 billion, Russia, 2025 | The energy circuit has grown by three orders of magnitude; the boundaries of USSR and the Russian Federation are different. |
| Scientific staff | There was no mass | ≈1,49 Millions of scientists, 1985 | ≈676 Thousands of R&D personnel, 2024 | The main risk is the reproduction of researchers and engineering equipment. |
| Demography | 125,64 million by empire, 1897 | 147,0 million in the RSFSR, 1989 | 146,03 million in the Russian Federation, 2025 | The size of the population is stable over a long stretch of the territory of the Russian Federation, but the age structure and natural decline worsen the balance. |
Five conclusions
• Physical scale is a necessary but insufficient condition for sustainability. USSR has created huge capacities, but by 1980 the return on additional resources was decreasing.
• The most successful technological breakthroughs occurred where fundamental science, government order, project management and serial production acted as a single circuit.
• The Academy has had the strongest influence on the measurement of territory and resources, the preparation of scientific schools, the formulation of complex tasks and expertise. It could not fix monetary, price, or political imbalances on its own.
• The most severe failures were the simultaneous rupture of several circuits: 1914–1921, 1941–1945, 1988–1998. The local deficit became systemic when the synchronization of transport, money, property, and data stopped.
• For horizon 2026–2035, it is not a single index of well-being that is needed, but a register of stocks, flows, standards and stress scenarios with explicit responsibility for data and decisions.
Methodology: how to read 130-year-old series
Unit of analysis
The national balance sheet is the reconciliation of stock, flow, reproduction and risk. Eight contours are considered for each era: population, food, energy, resources, industry and capital, infrastructure, finance and external account, knowledge and technology.
| Status | How it is used |
|---|---|
| FACT | Number or event from official/primary source. |
| HISTORICAL INTERPRETATION | Explain the relationship of indicators; allows for alternative interpretations. |
| EXPERT SYNTHESIS | Comparison of epochs within a single framework; estimates of tension are not government statistics. |
| PROJECT OFFER | Proposed monitoring architecture; not a description of the current state system. |
Major Comparability Gaps
• The territory: the census of 1897 did not include Finland; the Soviet ranks of 1913 are often recalculated within the future boundaries of USSR.
• Population: early censuses used the available population, later - permanent; the definition of the city changed.
• Prices: gold, Soviet and modern ruble are not comparable without special reconstructions. Preference is given to physical quantities.
• Science: "scientists" USSR and "R&D personnel" of the Russian Federation are close, but not identical in scope.
• Causality: The participation of the Academy is separated from the decision of the state and from the actual industrial effect.
Estimated accents
Electricity USSR has grown from 1,94 billion KW·H in 1913 the Year 1 705 billion KW·H in 1988 year, approximately in 879 One. This factor shows the scale of energy consumption, but does not measure well-being and is not transferred to the Russian Federation after 1991 years.
Map of 11 epochs
| Period | Epoch | Dominant logic of balance |
|---|---|---|
| 1896–1913 | Imperial Modernization | Rapid growth of the upper industrial and financial contours in a predominantly rural and illiterate society. |
| 1914–1921 | War, Revolution and the Breakup of Economic Relations | Mobilization destroyed the gold money regime, and then a single circuit of supply, transport and property. |
| 1922–1928 | NEP and Recovery | The return of limited market incentives restored the exchange between the countryside and the city; energy became the first nationwide balance. |
| 1929–1940 | Forced industrialization | The state concentrated investments in heavy industry and energy, taking a high social and agricultural price. |
| 1941–1945 | Military-mobilization balance | The main criterion was not the maximization of output, but the preservation of critical functions with the loss of territory, people and capacities. |
| 1946–1964 | Recovery and technological breakthrough | The reconstruction of the industry coincided with the creation of nuclear, rocket and space and mass educational contours. |
| 1965–1985 | Mature USSR: scale and decreasing efficiency | The material and scientific scale reached a maximum, but the return on additional resources decreased, and the consumer and innovative contours lagged behind. |
| 1986–1991 | Restructuring and disintegration of a single contour | Attempting to change incentives without a sustainable price, property, and inter-republic settlement architecture has turned hidden imbalances into open ones. |
| 1992–1999 | Transition shock of the Russian Federation | Market institutions were created simultaneously with the collapse of demand, cooperation, budget and scientific and production ties. |
| 2000–2013 | Stabilization and resource and financial strengthening | High export earnings, tax centralization and capacity utilization have restored macroeconomic and social balances. |
| 2014–2026 | Adaptation and structural turn | The economy remains resilient to external shocks but faces demographic contraction, staffing constraints and the challenge of technological autonomy. |
Periodization principle: the boundary of the epoch is put where the mechanism of resource coordination changes - monetary regime, property, planning, mobilization, external contour or the architecture of science.
1. 1896–1913 Imperial modernization
Numerical passport of the era
| Indicator | Number | Coverage and date | Source |
|---|---|---|---|
| Population | 125,64 million | Russian Empire without Finland, census 1897 | [S01] |
| Urban population | 13,4% | Russian Empire, 1897 | [S04] |
| Literacy | 21,1%; male 29,3%, female 13,1% | Russian Empire, 1897 | [S04] |
| Life expectancy | ≈30,5 years | Russian territory, 1896–1897; historical assessment | [S04] |
| Grain | ≈50,5 million tons; about 560 kg per person | Russia, 1913; rounded | [S04] |
| Electricity | ≈1,94 billion KW·h | USSR in future borders, 1913 | [S08] |
| Coal | 29,2 mln t | USSR in future borders, 1913 | [S07] |
1. 1896–1913 Numerical passport — continuation
| Indicator | Number | Coverage and date | Source |
|---|---|---|---|
| Oil | ≈10,3 million tons | USSR in future borders, 1913 | [S07] |
| Steel | ≈4,2 million tons | USSR in future borders, 1913 | [S07] |
| Railways | ≈70,2 thousand km | Russian Empire, 1913/14 | [S36] |
| Balance of the State Bank | 3,041 billion rub.; gold 1,695 billion rub. | by 1 January 1914 | [S06] |
Role of the Academy of Sciences
The Academy created maps, classifications, scientific schools and resource exploration. V 1910 The Radiation Commission was established in the 1915 KEPS: prototype of a bundle "resource register - scientific expertise - state order".
The National Balance
2. 1914–1921 War, revolution and disintegration of economic relations
Numerical passport of the era
| Indicator | Number | Coverage and date | Source |
|---|---|---|---|
| Population | 91,0 million | territory of modern Russia, rating 1917 | [S03] |
| Urban share | 17% | territory of modern Russia, 1917 | [S03] |
| The Gold Exchange | Terminated | from July 1914 | [S05] |
| Large industry | ≈14% from the level 1913 | RSFSR/USSR, 1920; historical evaluation | [S09] |
| Electricity | near 0,5 billion KW·h | territory of the RSFSR/USSR, 1920; rounded | [S08] |
| Grain | ≈50,5 → 34,0 million tons | the Russian Territory: 1913 → 1922; −33% | [S04] |
| Income per soul | <50% Levels 1913 | 1919; historical reconstruction | [S09] |
| The railway system | peak overload and ruptures | quality total, 1916–1921 | [S36] |
| KEPS | created in 1915 | Academy of Sciences | [S11] |
Role of the Academy of Sciences
KEPS searched for strategic raw materials and coordinated specialists, but did not manage the budget, transport or distribution. Its most important effect was postponed: institutional groundwork passed into the Soviet period.
The National Balance
3. 1922–1928 NEP and Recovery
Numerical passport of the era
| Indicator | Number | Coverage and date | Source |
|---|---|---|---|
| Population | 92,7 million | territory of modern Russia, census 1926 | [S03] |
| Urban share | 18% | territory of modern Russia, 1926 | [S03] |
| Life expectancy | ≈42,9 years | territory of Russia, 1926–1927 | [S04] |
| Grain | 34,0 → 50,0 million tons | the Russian Territory: 1922 → 1928; +47% | [S04] |
| Electricity | 5,0 billion KW·h | USSR, 1928; 2,6 times to 1913 | [S08] |
| Coal | 35,5 mln t | USSR, 1928 | [S09] |
| Oil | 11,6 mln t | USSR, 1928 | [S09] |
3. 1922–1928 Numerical passport — continuation
| Indicator | Number | Coverage and date | Source |
|---|---|---|---|
| Steel | 4,3 mln t | USSR, 1928 | [S09] |
| GOELRO | 1,75 million kW according to plan; 2,56 million kW commissioned | New Power Plants | [S10] |
| Universities | 248; 216,7 Thousands of students | USSR, 1922/23 academic year | [S15] |
Role of the Academy of Sciences
The KEPS and its resulting Council for the Study of Productive Forces linked geology, industrial location, and electrification. The KEPS/SOPS subsequently established 16 institutes.
The National Balance
4. 1929–1940 Forced Industrialization
Numerical passport of the era
| Indicator | Number | Coverage and date | Source |
|---|---|---|---|
| Electricity | 5,0 → 13,5 → 36,2 → 48,3 billion KW·h | USSR: 1928 / 1932 / 1937 / 1940 | [S08] |
| Coal | 35,5 → 64,4 → 128 → 166 million tons | USSR: 1928 / 1932 / 1937 / 1940 | [S09] |
| Oil | 11,6 → 21,4 → 28,5 → 31,1 million tons | USSR: 1928 / 1932 / 1937 / 1940 | [S09] |
| Steel | 4,3 → 5,9 → 17,7 → 18,3 million tons | USSR: 1928 / 1932 / 1937 / 1940 | [S09] |
| Grain | 47,5 → 70,4 → 55,6 million tons | territory of Russia: 1932 / 1937 / 1940 | [S04] |
| Population | 108,4 million | territory of modern Russia, census 1939 | [S03] |
| Urban share | 33% | territory of modern Russia, 1939 | [S03] |
| University students | 811,7 thousand. | USSR, 1940/41 academic year | [S15] |
| Institutional shift | The Academy moved to Moscow; branch offices | 1934–1935 | [S20] |
Role of the Academy of Sciences
Academic expeditions and institutions have reduced uncertainty on raw materials, energy, metallurgy, and placement. The scientific network became part of the planned circuit, but decisions about the pace and price of industrialization were made politically.
The National Balance
5. 1941–1945 Military mobilization balance
Numerical passport of the era
| Indicator | Number | Coverage and date | Source |
|---|---|---|---|
| Total demographic losses | ≈26,6 million people | USSR, official estimate | [S14] |
| Population of RSFSR | ≈111,0 → 97,6 million | 1941 → Home 1946; evaluation | [S14] |
| Grain | 55,6 → 25,4 million tons | the Russian Territory: 1940 → 1945; −54% | [S04] |
| GDP | ≈66% / 83% Levels 1940 | USSR: 1942 / 1945; reconstruction | [S09] |
| Release of weapons | ≈251% Levels 1940 | USSR, 1944; index | [S09] |
| Electricity | 48,3 → 43,3 billion KW·h | USSR: 1940 → 1945 | [S08] |
| Oil | 31,1 → 19,4 million tons | USSR: 1940 → 1945 | [S09] |
5. 1941–1945 Numerical passport — continuation
| Indicator | Number | Coverage and date | Source |
|---|---|---|---|
| Steel | 18,3 → 12,3 million tons | USSR: 1940 → 1945 | [S09] |
| FTI: The Primary Flow of Ideas | 847 Proposals for the first 2 Months | Commission led by N. N. Semenova, 1941 | [S13] |
| Impulse radar "Redout" | detection range up to 150 km | the School of Physics and Technology | [S13] |
| FTI in Kazan | 8 from 18 laboratories; about 70 employees | Evacuation 1941 | [S13] |
| FTI Dissertations | 38: 10 PhD and 28 PhD | 1941–1945 | [S13] |
Role of the Academy of Sciences
The Academy provided a fast cycle of "task front - laboratory solution - implementation": demagnetization of ships, radar, ice track safety, medicine, nuclear reserve. These are testable cases, not grounds for attributing the entire military result to science.
The National Balance
Verified case: FTI during the war
Summer 1941 the FTI 's 18 Laboratories and more 300 staff. Commission led by N. N. Semenova 847 proposals in the first two months. In Kazan evacuated 8 laboratories and about 70 employees; in the Leningrad group remained 103 Human. The results included demagnetization of ships, pulse radar and devices for safe driving on the ice trackS13].
6. 1946–1964 Recovery and technological breakthrough
Numerical passport of the era
| Indicator | Number | Coverage and date | Source |
|---|---|---|---|
| Electricity | 43,3 → 91,2 → near 292 billion KW·h | USSR: 1945 / 1950 / 1960 | [S08] |
| Oil | 19,4 → 37,9 → 147,9 million tons | USSR: 1945 / 1950 / 1960 | [S09] |
| Steel | 12,3 → 27,3 → near 65 million tons | USSR: 1945 / 1950 / 1960 | [S09] |
| Electricity of RSFSR | 63,4 → 304,6 billion KW·h | 1950 → 1964; ×4,8 | [S15] |
| Grain | 46,8 → 83,2 million tons | territory of Russia: 1950 → 1964 | [S04] |
| Population | 117,2 million | territory of modern Russia, census 1959 | [S03] |
| Urban share | 52% | territory of modern Russia, 1959 | [S03] |
6. 1946–1964 Numerical passport — continuation
| Indicator | Number | Coverage and date | Source |
|---|---|---|---|
| Life expectancy | ≈67,9 → 69,6 years | Russia: 1958/59 → 1964/65 | [S04] |
| Reactor F-1 | Start 25 December 1946 | The first uranium-graphite reactor in Eurasia | [S18] |
| Sputnik / Gagarin | 1957 / 1961 | USSR | [S19] |
| Siberian Branch of AN USSR | created in 1957 | New territorial model of science | [S17] |
Role of the Academy of Sciences
The academic environment was at the core of cross-industry projects: physics, mathematics, chemistry, materials science and geology combined with closed KB and industry. The creation of SO AN USSR brought the research closer to the resource base of Siberia.
The National Balance
7. 1965–1985 Mature USSR: scale and decreasing efficiency
Numerical passport of the era
| Indicator | Number | Coverage and date | Source |
|---|---|---|---|
| Electricity | 507 → 1 039 → 1 544 billion KW·h | USSR: 1965 / 1975 / 1985 | [S15] |
| Oil | 243 → near 491 → near 595 million tons | USSR: 1965 / 1975 / 1985 | [S15] |
| Coal | 578 → near 701 → near 726 million tons | USSR: 1965 / 1975 / 1985 | [S15] |
| Steel | 91 → near 141 → near 155 million tons | USSR: 1965 / 1975 / 1985 | [S15] |
| Electricity of RSFSR | 332,8 → 962 billion KW·h | 1965 → 1985; ×2,9 | [S15] |
| Life expectancy | ≈69,5 → 68,1 years | RSFSR: 1965 → 1985 | [S04] |
| Import of grain | 45,5 mln t | USSR, 1984 | [S15] |
7. 1965–1985 Numerical passport — continuation
| Indicator | Number | Coverage and date | Source |
|---|---|---|---|
| Fuel and raw materials in export | ≈16% → 54% | USSR: 1960 → 1985 | [S15] |
| Population of RSFSR | 129,9 → 137,4 → 147,0 million | Census 1970 / 1979 / 1989 | [S03] |
| Urban share of RSFSR | 62% → 69% → 73% | 1970 / 1979 / 1989 | [S03] |
| Science workers | 664,6 thousands. → 1 223,4 thousands. → near 1 491 thousands. | USSR: 1965 / 1975 / 1985 | [S16] |
| University students | 4,58 million | USSR, 1970 | [S15] |
| Average annual growth of national income | 7,5% → 5,8% → 3,8% | 8th / 9th / 10th Five-Year Plans | [S15] |
Role of the Academy of Sciences
The Academy provided a fundamental base of defense, space, energy and geological programs. The weak link was the transition from the result of the institute to mass civil technology and productivity.
The National Balance
8. 1986–1991 Alteration and decay of a single contour
Numerical passport of the era
| Indicator | Number | Coverage and date | Source |
|---|---|---|---|
| Electricity | 1 544 → 1 705 billion KW·h | USSR: 1985 → 1988; then stagnation | [S15] |
| Oil | near 595 → 624 million tons | USSR: 1985 → 1988; then decline | [S15] |
| Science workers | about 1,49 million | USSR, 1985; system peak | [S16] |
| Population savings | near 230 billion rub. | deposits in savings banks, 1985; nominal value | [S15] |
| Population of RSFSR | 147,0 million | Census 1989 | [S03] |
| Urban share of RSFSR | 73% | Census 1989 | [S03] |
| Life expectancy | ≈70,1 years | RSFSR, 1986–1987 | [S04] |
8. 1986–1991 Numerical passport — continuation
| Indicator | Number | Coverage and date | Source |
|---|---|---|---|
| Electricity of RSFSR | ≈1 082 billion KW·h | 1990 | [S15] |
| Grain | ≈116,7 million tons | RSFSR, 1990 | [S04] |
| RAS | restored by decree 21 November 1991 | institutional continuity | [S21] |
Role of the Academy of Sciences
The scientific complex remained large, but depended on the federal budget, customers and chains of cooperation. The Academy could diagnose problems, but not replace the mechanism of prices, budget and political coordination.
The National Balance
9. 1992–1999 Transition shock of the Russian Federation
Numerical passport of the era
| Indicator | Number | Coverage and date | Source |
|---|---|---|---|
| CPI | ≈2 508,8% | Russia, 1992 to 1991 | [S24] |
| Real GDP | decrease of approximately 40% | Russia, 1991–1998; order of magnitude | [S23] |
| Population | near 147 million → 146,3 million | Russia, beginning and end of the decade | [S03] |
| Life expectancy | 64,0 → 65,9 years | Russia: 1994 → 1999 | [S25] |
| Grain | 116,7 → 47,8 million tons | Russia: 1990 → 1998; −59% | [S04] |
| Researchers | 992,6 → 425,9 thousands. | Russia: 1990 → 2000; −57%; separate category | [S30] |
| R&D staff | 1 061 thousand | Russia, 1995 | [S30] |
9. 1992–1999 Numerical passport — continuation
| Indicator | Number | Coverage and date | Source |
|---|---|---|---|
| Oil production | about 305 million tons | Russia, minimum end 1990-x | [S32] |
| Electricity | near 846 billion KW·h | Russia, 1998; rounded | [S32] |
| International reserves | about 12,5 billion dollars | Russia, end 1999; order of magnitude | [S33] |
| RAS | legal status restored to 1991 | Russia | [S21] |
Role of the Academy of Sciences
The Academy has maintained schools and continuity with a sharp reduction in funding and staff outflows. Its contribution of the period is the preservation of a critical mass of competencies, and not compensation for the macroeconomic recession.
The National Balance
10. 2000–2013 Stabilization and resource and financial strengthening
Numerical passport of the era
| Indicator | Number | Coverage and date | Source |
|---|---|---|---|
| Average GDP growth | ≈6,9% per year | Russia, 1999–2008 | [S23] |
| Oil production | ≈305 → 523 million tons | Russia, 1999 → 2013 | [S32] |
| Electricity | ≈878 → 1 059 billion KW·h | Russia, 2000 → 2013; +21% | [S32] |
| Grain | 65,4 → 92,4 million tons | Russia: 2000 → 2013; +41% | [S04] |
| Life expectancy | ≈65,3 → 70,8 years | Russia, 2000 → 2013 | [S25] |
| Total fertility rate | 1,20 → 1,71 | Russia: 2000 → 2013 | [S25] |
| Poverty | 29,0% → near 10,8% | Russia, 2000 → 2013 | [S27] |
10. 2000–2013 Numerical passport — continuation
| Indicator | Number | Coverage and date | Source |
|---|---|---|---|
| International reserves | ≈12,5 → 510 billion dollars | End 1999 → End 2013; Rounded | [S33] |
| Public debt | 55,9% → 12,7% GDP | Russia: 2000 → 2013 | [S33] |
| R&D staff | ≈888 → 727 thousands. | Russia, 2000 → 2013 | [S30] |
| Urban share | 73% → 74% | Census 2002 → 2010 | [S03] |
Role of the Academy of Sciences
The RAS maintained a fundamental school and expert function, but the gap between research, universities, public corporations, and private business remained significant.
The National Balance
11. 2014–2026 Adaptation and structural rotation
Numerical passport of the era
| Indicator | Number | Coverage and date | Source |
|---|---|---|---|
| Average GDP growth | ≈0,9% per year | Russia, 2014–2019 | [S23] |
| GDP growth by year | −1,4%; +4,1%; near +4–5%; +1,0% | 2022 / 2023 / 2024 / 2025; the 2024 figure was revised | [S23] |
| GDP growth | ≈1,0% | Russia, 2025; first estimate | [S23] |
| Population | 146,03 million | Russia, at 1 January 2025 | [S25] |
| Birth / Death | 1,222 / 1,819 million | Russia, 2024 | [S26] |
| Total fertility rate | ≈1,4 | Russia, 2024 | [S26] |
| Life expectancy | 73,34 → 70,06 → 73,41 years | Russia: 2019 / 2021 / 2023 | [S25] |
11. 2014–2026 Numerical passport — continuation
| Indicator | Number | Coverage and date | Source |
|---|---|---|---|
| Grain | 92,4 → 125,9 million tons | Russia: 2013 → 2024 | [S04] |
| Poverty | 6,7% | Russia, 2025; new technique after 2021 | [S28] |
| R&D staff | about 676 thousand. | Russia, 2024 | [S29] |
| Domestic R & D costs | 0,97% GDP | Russia, 2024 | [S31] |
| Electricity | 1 183,9 billion KW·h | Russia, 2025 | [S32] |
| Oil / Gas / Coal | 511,5 million tons / 663,3 billion m³ / 440 million tons | Russia, 2025 | [S32] |
| Examination of the RAS | >80 Thousands of conclusions; 661 Organization | last reporting year | [S35] |
Role of the Academy of Sciences
After the reform of 2013, the RAS does not manage most of the institutes as before, but remains a center of expertise, coordination and scientific representation. The scale of the examination is more than 80 thousand conclusions for more than 1 000 organizations, including 661 institute and university.
The National Balance
End-to-end balance 1. Population and urbanization
Sources: Rosstat [S03], [S25]. The series refers to the territory of modern Russia; the early points have been reconstructed. The proportion of 2025 is rounded.
A long trend is the transition from rural to urban society. After the 1990s, the population hovers around 143–147 million, but the birthrate of 1,222 million versus 1,819 million deaths in 2024 shows a reproduction deficit. Therefore, the stability of the total population is not equal to the demographic balance.
End-to-end balance 2. Energy as a system framework
Sources: historical series [S08], [S15]; modern results [S32]. Rows USSR and the Russian Federation are divided due to the territorial gap.
GOELRO was not just a plan for power plants: it linked the location of productive forces, fuel, networks and industrial hubs. K 2025 the Russian Federation 1 183,9 billion KW·h at the installed capacity 270,3 GWh. Modern risk has shifted from absolute power shortage to reliability of networks, equipment and availability of power for new industries.
End-to-end balance 3. Physical scale of the industry
Sources: [S07]–[S09], [S15] Index 1913 = 100; logarithmic scale; Soviet recalculations 1913 Years in the Future Frontiers USSR.
K 1985 Electricity production was approximately 796 times higher 1913 Oil, about a year 58 once, became — in 37 Once, coal in 25 One. The pace difference shows the change of the technological core: from the coal-metallurgical base to the oil and gas and electric power system.
End-to-end balance 4. Scientific staff
Sources: [S16], [S29], [S30]. The indicators differ in methodology, so the panels are not connected.
V USSR The number of scientists has more than doubled 1965 and 1985 years. R&D staff in Russia has declined 1,061 Millions in 1995 Year to approximately 676 thousands in 2024 the Year - in 36%. At the cost 0,97% GDP in 2024 Quantitative reproduction of the research circuit remains a limitation.
End-to-end balance 5. Where the tension builds up
Expert synthesis of the author based on numerical passports. This is not an official statistical index.
Critical epochs coincide with the loss of coordination of several systems at once. In the years 1914–1921 and 1992–1999, the financial and institutional gap increased production. In 1941–1945, the external threat was maximum, but centralized mobilization retained the controllability of critical flows.
How the Academy of Sciences Affected National Balance Sheets
| Channel | Mechanism | Balanced effect | Example |
|---|---|---|---|
| Measurement | censuses, maps, classifications, standards | Reducing errors in resource and spatial planning | KEPS, expeditions |
| Resource base | Geology, mineralogy, soil science | Opening and evaluation of stocks | Kola Peninsula, CMA, Siberia |
| Energy | physics, energy, materials | technology selection and placement | GOELRO, nuclear power |
| Defence | mathematics, physics, chemistry, medicine | Reducing the cycle from task to implementation | demagnetization, radar, nuclear project |
| Human capital | Scientific Schools and Postgraduate Studies | Reproduction of researchers | FTI, SO AN USSR |
| Territorial development | Integrated programs | Linking science with the resource region | Siberian Branch |
| Expertise | Programme and outcome evaluation | quality of solutions and project filtering | >80 thousand conclusions in the last report |
| Cultural Capital | languages, history, archives, collections | Preservation of identity and memory | Pushkin House, archives |
Eight institutional milestones
| Year | Vekah | Modification of the mechanism |
|---|---|---|
| 1915 | KEPS | Transition from discipline to economic problem |
| 1925 | AN USSR | inclusion of the Academy in the Union planning system |
| 1934–1935 | Moscow and branch offices | Convergence with central management and industrial tasks |
| 1941–1945 | Military mobilization of science | short cycle of implementation |
| 1943–1946 | Laboratory No. 2 and F-1 | the Nuclear Technology Outline |
| 1957 | SB AN USSR | territorial decentralization of the scientific network |
| 1991 | Rebuilding the RAS | legal continuity after dissolution USSR |
| 2013–2026 | Reform and Expert Model | Transition from direct management of institutions to coordination and expertise |
Limits of Academic Influence
• Academy does not set prices, taxes and interest rates; therefore, it is not able to restore the cash balance on its own.
• Scientific discovery is not equal to implementation: we need a customer, pilot production, standards, capital and responsibility for the serial result.
• The Academy is not the whole science of the country. Universities, industry institutes, design bureaus, factory laboratories and departmental services have independent contributions.
• A strong dependence on the budget and personnel policy makes the Academy both a pillar of the state and a vulnerable part of the long investment cycle.
• Quantitative metrics of publications and conclusions do not replace estimates of the real technological effect.
Project proposal: Academic Register of National Balance Sheets
| Layer | What is stored | Quality control | User |
|---|---|---|---|
| Reserves | population, capacity, reserves of raw materials, fixed assets, scientific equipment | single date and territory of assessment | Government, regions, corporations |
| Streams | energy, water, food, investment, personnel, import of technologies | material and monetary units | Industry Headquarters |
| Norms | minimum security, reserve, recovery period | scientific expertise and open methodology | Regulators |
| Scripts | sanctions, climate, accidents, demography, technological gap | Stress test and sensitivity | Security Council, Government |
| Decisions | responsible, time, budget, expected effect | subsequent verification of result | Project Offices |
Minimum set of indicators
• Demographics: population by age, healthy life expectancy, migration, availability of key professions.
• Energy and resources: available capacity, network constraints, inventory by category, time of development and import dependence of equipment.
• Food and water: release, shifting stocks, logistics, regional deficits, climate sensitivity.
• Science and technology: age researchers, equipment, critical competencies, time from result to series.
• Finance: investment, long credit, external account, budget sensitivity to raw material prices.
Road map 2026–2035
| Horizon | Action | Measurable result |
|---|---|---|
| 0–90 days | Approve 40–60 key balances and data passports; choose three pilots. | A single catalog of indicators, owners and quality gaps. |
| 3–12 months | Pilots: scientific personnel and equipment; electricity for new industrial units; food and water balance. | Three stress tests and a list of solutions with a budget and responsible. |
| 1–3 years | Integrate regional and industry showcases; introduce independent academic verification. | Regular report on stocks, flows and risks. |
| 3–10 years | Link the register with the investment cycle, state programs and technological projects. | Reduction of reaction time and share of projects without providing a resource. |
The First Three Pilots
Annex 1. Population control points
| Year | Total, million | City, million | Urban share | Note |
|---|---|---|---|---|
| 1897 | 67,5 | 9,9 | ≈15% | territory of the modern Russian Federation; available population |
| 1914 | 89,9 | 15,7 | 17% | Assessment within current boundaries |
| 1917 | 91,0 | 15,5 | 17% | Assessment within current boundaries |
| 1926 | 92,7 | 16,4 | 18% | census; available population |
| 1939 | 108,4 | 36,3 | 33% | census; available population |
| 1959 | 117,2 | 61,1 | 52% | Census; permanent population |
| 1970 | 129,9 | 80,6 | 62% | Census |
| 1979 | 137,4 | 94,9 | 69% | Census |
| 1989 | 147,0 | 107,9 | 73% | Census |
| 2002 | 145,2 | 106,4 | 73% | Census |
| 2010 | 142,9 | 105,3 | 74% | Census |
| 2025 | 146,03 | — | about 75% | Ongoing assessment; Crimea and Sevastopol are taken into account according to the Rosstat method |
Source: [S03], [S25]. Values are rounded; by 1959, the type of population accounting is changing.
Annex 2. Electricity and base industry USSR
| Year | Electricity, billion KW·h | Coal, million tons | Oil, million tons | Steel, million tons |
|---|---|---|---|---|
| 1913 | 1,94 | 29,2 | 10,3 | 4,2 |
| 1928 | 5,0 | 35,5 | 11,6 | 4,3 |
| 1932 | 13,5 | 64,4 | 21,4 | 5,9 |
| 1937 | 36,2 | 128 | 28,5 | 17,7 |
| 1940 | 48,3 | 166 | 31,1 | 18,3 |
| 1945 | 43,3 | ≈149 | 19,4 | 12,3 |
| 1950 | 91,2 | ≈261 | 37,9 | 27,3 |
| 1965 | 507 | 578 | 243 | 91 |
| 1975 | 1 039 | ≈701 | ≈491 | ≈141 |
| 1985 | 1 544 | ≈726 | ≈595 | ≈155 |
| 1988 | 1 705 | ≈772 | 624 | ≈163 |
Sources: [S07]–[S09], [S15] Sign ≈ means the rounding or rounding of close official rows. Point 1913 Usually counted in future borders USSR.
Annex 3. Scientific personnel and institutional points
| Year | Indicator | Value | Coverage |
|---|---|---|---|
| 1965 | Science Workers | 664,6 thousand. | USSR |
| 1970 | Science Workers | 927,7 thousand. | USSR |
| 1975 | Science Workers | 1 223,4 thousand | USSR |
| 1985 | Science Workers | ≈1 491 thousands. | USSR |
| 1995 | R&D staff | 1 061 thousand | Russian Federation |
| 2000 | R&D staff | ≈888 thousands. | Russian Federation |
| 2010 | R&D staff | ≈737 thousands. | Russian Federation |
| 2024 | R&D staff | ≈676 thousands. | Russian Federation |
| 2024 | R & D costs | 0,97% GDP | Russian Federation |
| Latest Report | Expert Opinions of the RAS | >80 thousands. | for >1 000 organizations |
Sources: [S16], [S29], [S31], [S35]. The Soviet and Russian indicators are not completely identical.
Annex 4. Sources
Priority is given to official statistics, primary historical collections and materials of state scientific organizations. The links are checked for the date of preparation.
[S01] First general census of the Russian Empire: the original codex of the Central Committee of the Ministry of Internal Affairs
[S02] Presidential Library: First Census 1897
[S03] Rosstat: historical number and share of urban population in the territory of modern Russia
[S04] Rosstat: census history, literacy and infrastructure
[S05] Bank of Russia: History of the Monetary System and the State Bank
[S06] Bulletin of the Bank of Russia: State Bank balance sheet and gold at 1 January 1914
[S07] MSU: database on Russian industry and USSR
[S08] Isthmath: electricity production USSR, 1913–1950
[S09] National economy USSR: industry, historical series up to 1955 years
[S10] Ministry of Energy of Russia: history of GOELRO plan
[S11] Presidential Library: Creation of KEPS
[S12] RAS: KEPS, Council for the Study of Productive Forces and Established Institutions
[S13] RAS: The Great Patriotic War in the history of FTI
[S14] Rosstat: "Victory figures"
[S15] National economy USSR in 1987: official statistical yearbook
[S16] Isthmat: number of scientists USSR
[S17] Siberian Branch of the Russian Academy of Sciences: history of creation
[S18] Research Center "Kurchatov Institute": the history of Laboratory No 2
[S19] Roscosmos: the key dates of domestic space exploration
[S20] RAS: 300 years of history, institutional changes of the Academy
[S21] RAS: statute and general provisions; restoration of RAS in 1991
[S22] Federal Law No. 253-FZ of 27.09.2013
[S23] Rosstat: National Accounts and GDP Dynamics
[S24] Rosstat: prices and inflation
[S25] Rosstat: demography
[S26] Rosstat: natural population movement for the year 2024
[S27] Rosstat: historical indicators of poverty
[S28] Rosstat: preliminary poverty assessment for the year 2025
[S29] Rosstat: science, innovation and technology
[S30] Rosstat: a historical series of personnel engaged in research and development
[S31] HSE ISSEZ: Research and Development Costs in 2024
[S32] Ministry of Energy of Russia: results of fuel and energy sector activity for 2025 year
[S33] Bank of Russia: international reserves of the Russian Federation
[S34] Bank of Russia: balance of payments of the Russian Federation
[S35] RAS: report on the activities and scale of scientific expertise
[S36] Russian Railways: the history of the Trans-Siberian Railway
Source materials
Originals and versions of the document
- Balansy_Rossii_1896-2026_Akademiya_nauk.docxDOCX · main document
- Balansy_Rossii_1896-2026_Akademiya_nauk.pptxPPTX · related version
Other editions in web format
Each version is disclosed separately; the sequence of the source document is saved.
130Balansy_Rossii_1896-2026_Akademiya_nauk.pptx · webtext+
Balances of Russia for 130 years
YEARS
1896–2026
11 EPOH
Russian Empire • USSR • Russian Federation
5 THROUGH BALANCES
The influence of the Academy of Sciences on demographic, resource, energy, industrial and scientific-technological balances
The key question is: how did scientific knowledge become a state capacity?
Prepared for Sokolov Sergey Leonidovich
27 August 2026
For 130 years, the system changed - the task remained
SUMMARY FOR DECISIONS
To reconcile supply, flow, reproduction, and risk in different institutional regimes.
→ 1,061 676 thousand
13,4% → ≈75%
1,94 → 1 705
urban share
billion KW·h
R&D staff
Empire 1897 → Russian Federation 2025; Different boundaries
USSR: 1913 → 1988; Increase approximately ×879
Russian Federation: 1995 → 2024; near −36%
The Academy was most influential where it reduced uncertainty, created scientific schools and was built into the contours of task setting, ordering and implementation.
Crises arose with the simultaneous rupture of money, transport, property and data.
The scale of the industry itself did not guarantee efficiency and reproduction.
The current deficit is people, research personnel, equipment and long technological chains.
Three statistical bands - without false gluing
METHODICS
EMPIRE
USSR
RSFSR / RF
1897 / 1913
1926–1990
1959–2025
Census, State Bank balance sheet, industry estimates
USSR as a whole and individual points of the RSFSR
Censuses, Rosstat, Bank of Russia, R&D
Last implemented points on the cut August 2026: population — 1 January 2025; GDP — 2025; Electricity and R & D — 2024.
Do not connect: USSR 1990 with RF 1990; USSR with R&D staff of the Russian Federation; different age definitions of literacy.
One horizon - 11 different balance mechanisms
MAP EPOH
1896–1913
1914–1921
1922–1928
1929–1940
Imperial Modernization
War and Disintegration
NEP
Industrialization
Money + Railways
Mobilization + gap
Market + GOELRO
Plan + Heavy Industry
1941–1945
1946–1964
1965–1985
1986–1991
Military Balance
Recovery
Mature USSR
Alteration
Maximizing the release
atom + space + Siberia
scale > efficiency
Incentives without prices
1992–1999
2000–2013
2014–2026
Transition shock
Stabilisation
Adaptation
market + demand breakdown
Revenues + reserves
sustainability + personnel shortage
The boundary of the era is set where the way of harmonizing resources has changed: money, property, planning, mobilization or external contour.
1896–1913 | Imperial Modernization
NUMBER AGE PASSPORT
Rapid growth of industrial and financial contours in a predominantly rural and illiterate society.
125,64 million
13,4%
ACADEMY OF SCIENCE
Maps, classifications, resource intelligence. Radiation Commission — 1910; KEPS - 1915: prototype of a bundle "resource register - examination - state order".
population
urban share
Empire without Finland, 1897
Empire, 1897
21,1%
≈1,94 billion
literacy
kW·h
Monetary and railway modernization did not have time to close the shortage of mass education, energy and management information.
male 29,3%; female 13,1%
Future boundaries USSR, 1913
3,041 billion rub.
≈70,2 thousand km
State Bank balance sheet; gold 1,695 billion rub., 1.01.1914
Railways of the Empire, 1913/14
1914–1921 | War, Revolution and the Breakup of Ties
NUMBER AGE PASSPORT
At the same time, the money anchor, transport synchronization, property and statistical controllability broke down.
≈0,5 billion
ACADEMY OF SCIENCE
KEPS was looking for strategic raw materials and brought together specialists. The contribution was important, but could not replace the budget, transport, supply and political coordination.
large industry
kW·h
from level 1913 to 1920
rounded score 1920
50,5 → 34 million tons
Grain
income per person
The crisis turned out to be systemic: the fall in output was exacerbated by the gap between money, logistics and institutions.
1913 → 1922; near −33%
from level 1913 to 1919
91,0 million
July 1914
population within the boundaries of modern Russia, estimate 1917
the Golden Exchange
1922–1928 | NEP and Recovery
NUMBER AGE PASSPORT
Limited market incentives restored the exchange; energy became the first nationwide balance sheet.
34 → 50 million tons
5,0 billion
ACADEMY OF SCIENCE
KEPS and the SOPS that grew out of it linked geology, industrial location, and electrification; new institutions and resource schools emerged.
Grain
kW·h
1922 → 1928; near +47%
USSR, 1928
35,5 mln t
11,6 mln t
coal
Oil
By 1928, physical volumes had returned to roughly pre-war levels, but the balance remained vulnerable to prices and incentives.
USSR, 1928
USSR, 1928
1,75 mln kW
2,56 mln kW
the GOELRO Plan
In fact, new capacities have been introduced.
1929–1940 | Forced industrialization
NUMBER AGE PASSPORT
The state directed resources to heavy industry and energy, taking a high social and agricultural price.
5,0 → 48,3
35,5 → 166
ACADEMY OF SCIENCE
Expeditions and institutions reduced uncertainty about raw materials, energy, and location. The scientific network became part of the planned outline, but did not define its goals.
billion KW·h
million tons of coal
USSR, 1928 → 1940; ×9,7
USSR, 1928 → 1940; ×4,7
4,3 → 18,3
18% → 33%
million tons of steel
urban share
Over 12 years, energy has increased by almost 10 times, steel - more than 4 times; the defense capability has increased at the cost of agricultural and consumer stresses.
USSR, 1928 → 1940; ×4,3
Territory of Modern Russia, 1926 → 1939
216,7 → 811,7 thousands.
47,5 → 55,6 million tons
University students, 1928 → 1940
Grain: growth noticeably weaker than industry
1941–1945 | Military-mobilization balance
NUMBER AGE PASSPORT
The criterion was not efficiency, but maximization of output and preservation of critical functions with the loss of territory, people and capacities.
≈26,6 million
55,6 → 25,4
ACADEMY OF SCIENCE
FTI gave a test cycle "task front - laboratory - implementation": demagnetization of ships, radar, ice track. Science retained critical functions, but not the entire issue.
Demographic losses
million tons of grain
USSR, official estimate
the Russian Territory, 1940 → 1945
48,3 → 43,3
18,3 → 12,3
billion KW·h
million tons of steel
Centralized mobilization retained the controllability of critical flows, but the price was expressed primarily in human losses.
USSR, 1940 → 1945
USSR, 1940 → 1945
18 Laboratories
The FTI Commission considered the proposals for the first two months
and more than 300 FTI employees in summer 1941
43,3 → 292
NUMBER AGE PASSPORT
1946–1964 | Recovery and technological breakthrough
The reconstruction of the industry coincided with the creation of nuclear, rocket and space and mass educational contours.
19,4 → 147,9
ACADEMY OF SCIENCE
Physics, mathematics, chemistry and materials science formed the basis of the atomic and space projects. In 1957 Siberian branch was created - science approached the resource base.
billion KW·h
million tons of oil
USSR, 1945 → 1960
USSR, 1945 → 1960
12,3 → ≈65
million tons of steel
urban share
The recovery has moved into technological expansion; the strongest asset was a combination of science, education, industry research and serial production.
USSR, 1945 → 1960
RSFSR, census 1959
25.12.1946
1957 / 1961
Launch of the first reactor F-1
Gagarin's Satellite / Flight
507 → 1 544
NUMBER AGE PASSPORT
1965–1985 | Mature USSR: scale and decreasing efficiency
The material and scientific scale peaked, but returns to capital, resource renewal, and consumer balance deteriorated.
243 → ≈595
ACADEMY OF SCIENCE
The fundamental base of defense, space and energy programs was strong. Weaker worked the transition from the result of the institute to mass civil technology.
billion KW·h
million tons of oil
USSR, 1965 → 1985; ×3,0
USSR, 1965 → 1985
664,6 thousands. → ≈1,49 million
7,5% → 3,8%
growth of national income
Science Workers
The economy has accumulated enormous capacity and human capital, but the flow of efficiency has slowed: the scale has not compensated for weak incentives and a long implementation cycle.
average pace: 8- I am → 10- I'm a five-year-old
USSR, 1965 → 1985
45,5 mln t
16% → 54%
grain imports in 1984
Fuel and raw materials in export, 1960 → 1985
1 544 → 1 705
NUMBER AGE PASSPORT
1986–1991 | Restructuring and disintegration of a single contour
The attempt to change incentives without a stable architecture of prices, property and inter-republican settlements turned hidden imbalances into open ones.
≈595 → 624
ACADEMY OF SCIENCE
The scientific complex remained large, but depended on the federal budget, customers and chains of cooperation. The Academy could diagnose the problem, but not replace the price mechanism and political alignment.
billion KW·h
million tons of oil
USSR, 1985 → 1988; power reserve
USSR, 1985 → 1988
≈1,49 million
≈230 billion rub.
Science Workers
Savings of population
Stocks of productive and scientific capital were large, but monetary, commodity and institutional flows ceased to be consistent.
USSR, 1985; system peak
USSR, nominally to 1990
147,0 million
Population of the RSFSR, census 1989
urban share of the RSFSR, 1989
2 508,8%
NUMBER AGE PASSPORT
1992–1999 | Transition shock of the Russian Federation
The market and private property were created simultaneously with the collapse of demand, cooperation, budget and scientific and production ties.
ACADEMY OF SCIENCE
The RAS has maintained schools and continuity with a sharp contraction of funding and outflow of personnel. Its contribution is to preserve a critical mass of competencies, not to compensate for macroshock.
inflation
Real GDP
Russia, 1992
Russia, 1991–1998; order of magnitude
116,7 → 47,8
992,6 → 425,9 thousands.
million tons of grain
researchers
Price mechanism and private property emerged faster than long-term capital, trust and the system of scientific order; financial stabilization had a high social price.
RSFSR/RF, 1990 → 1998
Russia, 1990 → 2000
1,061 million
12,5 billion dollars
R&D personnel in the year 1995
international reserves by end 1999
≈6,9% per year
NUMBER AGE PASSPORT
2000–2013 | Stabilization and resource and financial strengthening
Export earnings, tax centralization, and capacity utilization quickly restored macro-resilience and social balance.
305 → 523
ACADEMY OF SCIENCE
The RAS maintained fundamental schools and expertise, but the link between research and universities, corporations, and private business remained uneven.
GDP growth
million tons of oil
Russia, 1999–2008
Russia, 1999 → 2013
12,5 → ≈510
65,3 → 70,8
billion reserves
OPG years
Revenues and financial reserves increased sharply, while the budget’s dependence on the future price of oil and the reproduction of the research circuit decreased.
End 1999 → End 2013
Russia, 2000 → 2013
29% → 10,8%
≈888 → 727 thousands.
Poverty, 2000 → 2013
R&D staff, 2000 → 2013
2014–2026 | Adaptation and structural turn
NUMBER AGE PASSPORT
The economy remains resilient to external shocks but faces demographic contraction, staffing constraints and the challenge of technological autonomy.
−1,4 / +4,1 / +4,9 / +1,0
0,9% per year
ACADEMY OF SCIENCE
After the reform of 2013, the RAS does not manage most institutions, but strengthens expertise and coordination. The latest report: more than 80 thousand conclusions for more than 1 000 organizations.
Average GDP growth
GDP growth
Russia, 2014–2019
2022 / 2023 / 2024 / 2025
1,222 / 1,819 million
0,97% GDP
Birth / Death
Internal R&D costs
Short-term adaptability is high; long-term risk is concentrated in the reproduction of populations, researchers, equipment, and civilian technology chains.
Russia, 2024
Russia, 2024
146,03 million
675,7 / 699,9 thousand
Population at 1 January 2025
R&D staff: traditional/extended coverage, 2024
Urbanization completed - no reproduction
PASSING BALANCE • POPULATION
67,5 → 146,0 million
population
Retrospective territory of Russia
≈15% → 75,1%
urban share
1897 → 2025; Borders have changed
1,222 < 1,819
Births <
Russia, 2024
Early points are reconstructed within the boundaries of modern Russia; 2021–2025 have a territorial gap relative to 2010.
Energy efficiency has given scale - now accessibility is important
SQUARE BALANCE • ENERGY
USSR: separate comparable series
RSFSR / RF: do not connect with USSR
1913 → 1988: approximately ×879. Modern risk has shifted from an absolute generation deficit to networks, equipment and connection times.
The scientific scale has grown - then the personnel contour has shrunk
SQUARE BALANCE • SCIENCE
USSR: "workers of science", ths.
RF: R&D personnel, ths.
The Soviet and Russian methods are different. In the expanded coverage of 2024 - 699,9 thousand; the intensity of R&D - 0,97% GDP.
The Academy operates through eight channels.
INFLUENCE OF SCIENCE ACADEMY
MEASUREMENT
RESOURCES
ENERGY
DEFENSE
Census • Cards • Standards
Geology • Mineralogy
Physics • Materials • Accommodation
short cycle of implementation
KADRA
TERRITORIES
EXPERTISE
CULTURE
School • Postgraduate
Integrated programs
Programme and outcome evaluation
archives • languages • memory
The correct contribution metric is reducing uncertainty, creating competencies and speeding up the solution of a complex problem, rather than attributing the Academy a share of GDP.
From KEPS to expertise: the mechanism of influence has changed
INSTITUTIONAL MEANS
1915
1943–46
1991
2018
KEPS
Lab. No2
RAS
new model
resource problem
the Nuclear Project
Recovery
coordination + examination
1925
1957
2013
2026
AN USSR
SB AN USSR
253‑FZ
the RAS Report
Union Contour
Science in Siberia
Management reform
>80 Thousands of conclusions
>80 thousands.
23 thousand.
Expert Opinions
Research Topics
Negative evaluations
the Latest Report of the RAS
the Coordination Circuit
the Expert Filtration
Science strengthens the state - but does not replace institutions
Boundaries of influence
ACADEMY MAY
ACADEMY CAN'T
Measure territory and resources
set prices and taxes
Establishing scientific schools
replace customer and serial production
Reducing technological uncertainty
independently agree on a budget
Check programs and results
Closing the Property and Incentive Gap
Reduce the task-solution cycle
Accrue to yourself the entire industry
The best result occurred when the Academy was built into the contour of the problem setting and effect acceptance, while maintaining the autonomy of the method.
Proposal: Academic Register of National Balance Sheets
PROJECT OFFER
RESERVES
Population • capacity • raw materials • health
FLOWS
energy • water • issue • investment
NORMATIVES
Reliability reserves • recovery time
SCENARIA
shocks • lags • sensitivity • cascades
DECISIONS
owner • term • budget • result check
The register does not describe the current system: it is a verifiable monitoring architecture with a passport of the source, version, owner and methodology.
The next step is a measurable pilot, not another report
ROAD CARD 2026–2035
0–90 days
Approve 40–60 key balances and data passports
3–12 months
Launch three pilots: personnel, power grid, food and water
1–3 years
Introduce independent academic verification of programs
3–10 years
Link the registry to the investment cycle and impact assessment
The main lesson of 130 years: science creates the state ability only when knowledge is combined with the order, data, implementation and responsibility for the result.
Sources indicated in the presentation 26
- https://rosstat.gov.ru/free_doc/new_site/rosstat/smi/perepis-120.htm
- https://www.ras.ru/news/shownews.aspx?id=3a945fb0-48c2-4ee2-92fb-1e18ee9f858d
- [/Sources]
- https://rosstat.gov.ru/free_doc/new_site/population/demo/demo11.htm
- https://www.booksite.ru/fulltext/1/001/008/113/313.htm
- https://issek.hse.ru/news/1082485052.html
- https://rosstat.gov.ru/storage/mediabank/52_10-04-2026.html
- https://issek.hse.ru/news/1097457454.html
- https://rosstat.gov.ru/storage/mediabank/Prom_proiz_06_2025.xlsx
- https://new.ras.ru/academy-new/300-let-istorii/velikie-potryaseniya/
- https://rosstat.gov.ru/bgd/regl/b03_33/IssWWW.exe/Stg/d020/i021430r.htm
- https://www.cbr.ru/queries/xsltblock/file/86200/-1/1201
- https://www.prlib.ru/history/619087
- https://minenergo.gov.ru/ministry/goelro-story
- https://95.rosstat.gov.ru/storage/mediabank/Rosstat_Tsifry_Pobedy%281%29.pdf
- https://www.ras.ru/news/shownews.aspx?id=99594c04-ea43-40d3-854d-6cbe3d39206b&print=1
- https://nrcki.ru/catalog/o-centre/uchastniki/kurchatovskij-institut/istoriya/
- https://www.roscosmos.ru/dates/2/
- https://www.sbras.ru/
- https://istmat.org/files/uploads/17728/narhoz_sssr_1987_intensifikaciya.pdf
- https://www.istmat.org/node/428
- https://rosstat.gov.ru/statistics/price
- https://rosstat.gov.ru/storage/mediabank/33_13-03-2026.html
- https://rosstat.gov.ru/folder/313/document/255130
- https://publication.pravo.gov.ru/Document/View/0001201309300001
- https://www.kremlin.ru/acts/bank/50542