Brief annotation
About the document
Comparison of long-term balances of China and the United States in the EQUILIBRIUM synchronisation model.
Balansy_Kitaya_SSHA_1896-2026_Equilibrium_Sinhronizatsiya.pptx
Downloading the document...
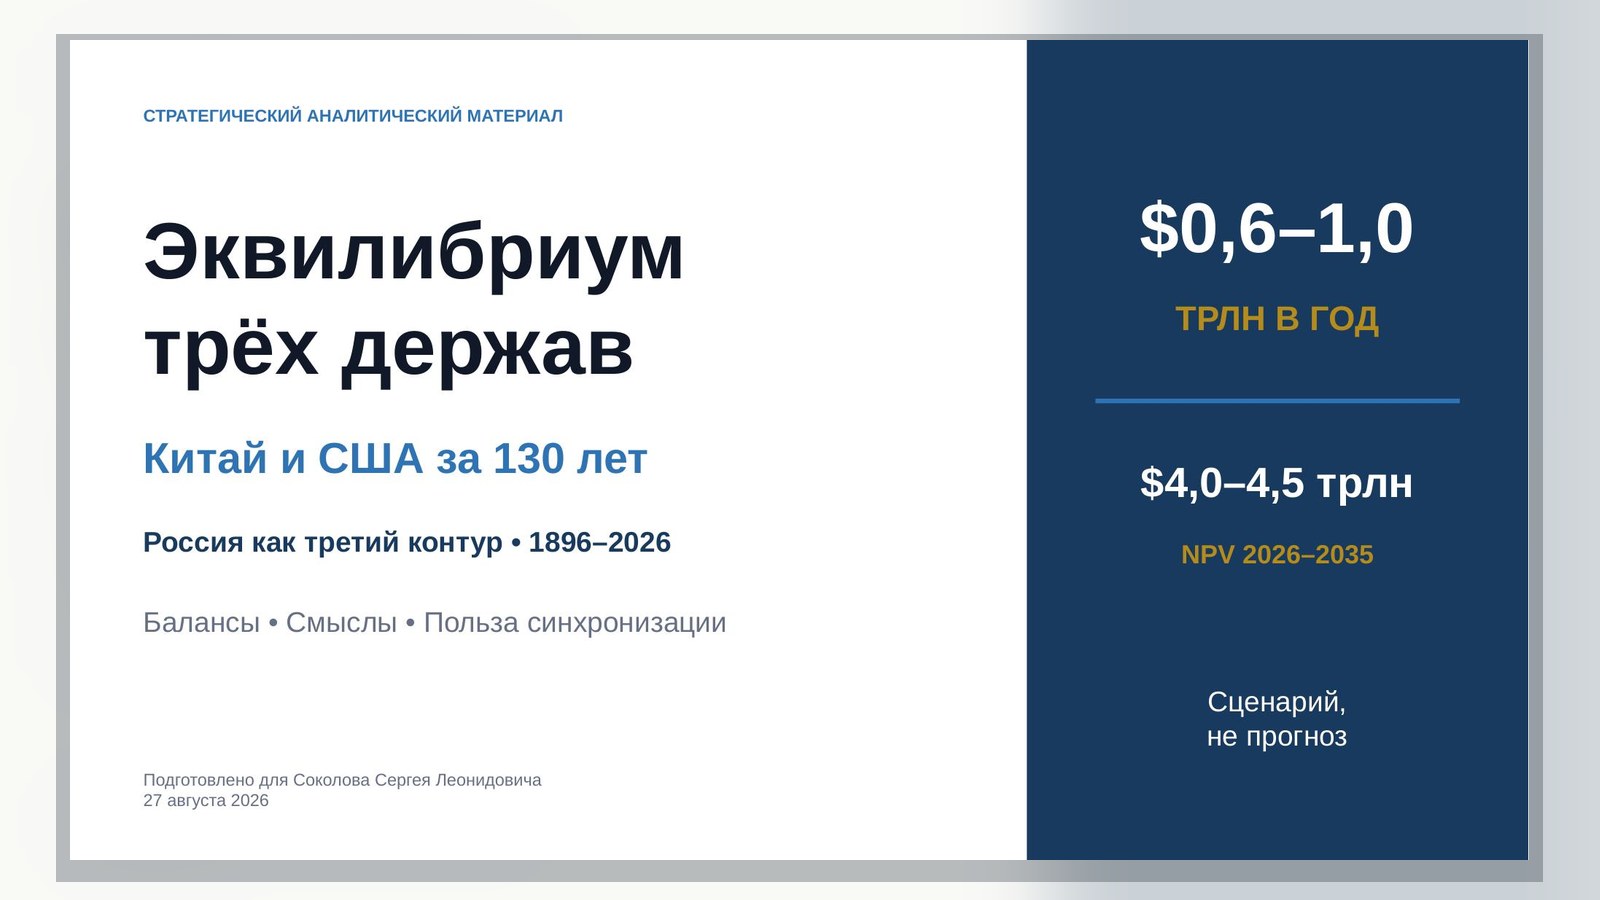
Russia as a Third Circuit • EQUILIBRIUM • Meanings • Benefits of Synchronization
— Historical analysis by era and scenario calculation 2026–2035 —
27 August 2026
Prepared for Sokolov Sergey Leonidovich
The actual horizon ends predominantly at 2025; 2026 is the cut-off date. All future effects are labeled as scenarios, not predictions.
Summary for decisions
| $52,83 trillion Nominal GDP of three countries 44,6% World Peace, 2025 | ≈51% World military expenditures 2025 | ≈49% Territorial Emissions CO₂ 2024 | $0,6–1,0 trillion Central Annual Dividend Scenario |
|---|
| The full integration of the three powers is unrealistic and undesirable. The modular synchronization of measurable public goods is realistic: strategic stability, climate and methane, pandemics, fundamental science, civil nuclear energy, compatible technical standards and emergency logistics. |
|---|
- China for 130 The country has moved from the disintegration of monetary and territorial ties to the largest production and electrical system in the world; its new deficit is demographics, domestic demand, housing and feedback.
- The United States has created the strongest link between federal science, entrepreneurship, capital, standards and allied networks; their weak point is debt, uneven infrastructure and the separation of financial and technological flows from social reproduction.
- Russia adds resource depth, nuclear-space and heavy engineering competencies, geographical stability; limitation is the weak transformation of strategic reserves into diversified civilian flows.
- The basic structural scenario ≈$1,00 trillion Net Annual Use 2035 the Year After 20%- his deduction of overlaps and ≈$4,49 trillion NPV the National Park 2026–2035. Conservative independent scrutiny ≈$0,60 trillion per year and ≈$4,02 trillion NPV.
- Nuclear, climate, epidemiological and technological tail risk are not monetized. Therefore, the monetary model is deliberately incomplete and rather underestimates the social value of safe coordination.
How to read EQUILIBRIUM
EQUILIBRIUM - not equality of forces and not the absence of conflict. It is the ability of the system to reproduce itself without destroying its own reserves, legitimacy and environment.
| Axis | What we measure | Typical gap |
|---|---|---|
| Reserves | Natural, productive, infrastructural, human, scientific, financial and institutional capital. | Resources do not become wealth. |
| Streams | Income, trade, investment, energy, productivity, diffusion of technology. | Rapid growth creates debt and critical dependencies. |
| Reproduction | Demography, health, education, R & D, depreciation, natural capital. | The current flow consumes the future. |
| Resilience | Diversification, reserves, food, energy, recovery time. | Efficiency normally turns into fragility in shock. |
| Legality | Trust, predictable rules, benefit sharing, feedback. | Coercion and one-off transactions replace sustained consent. |
| External effects | Emissions, depletion, future commitments, cross-border and military risks. | The benefits inside create more damage outside or in the future. |
Author's analytical framework; indicators are normalized relative to a safe corridor.
The Index Formula
E = 100 × ∏(sᵢ / 100)ʷⁱ. Geometric mean deliberately makes a weak measurement significant: high GDP cannot fully compensate for demographic failure or strategic instability.
| DYNAMIC CONDITION Reproduction + stock gain ≥ depreciation + damage + accumulated risk. |
|---|
Methods and limits of comparison
- 1896 is the beginning of the horizon, but the first hard points often refer to 1900, 1910 or 1913 years.
- Until 1950, Chinese GDP was an academic reconstruction of Maddison Project Database 2023 rather than official statistics. International dollars 2011 should not be mixed with current dollars.
- Mainland China, the Republic of China, the occupied territories, Hong Kong, Macau and Taiwan have different coverage in sources. The tables show the nearest comparable points.
- For the United States, federal debt, gross government debt, public debt, and non-financial corporations are different perimeters; they are not summed up mechanically.
- 2026 is the date of the publication cut. The last complete annual fact in most series is 2025; the forecast IMF on 2026 is not used as an observation.
- Scenario calculation of synchronization is a transparent model of the range, not a forecast, not an estimate of budget income and not a recommendation of a political union.
| Early figures are rounded; alternative reconstructions can change the sign of a short-term trend. Therefore, the key object of analysis is the order of magnitude, the balance mechanism and the direction of change, not the tenths of a percent. |
|---|
China: map of 130-year transition
| Period | Mechanism | Balance sheet |
|---|---|---|
| 1896–1911 | Late Qing: Modernization without Sovereign Control | Stocks of knowledge and infrastructure arose, but external dependence and low fiscal capacity did not allow them to turn into mass income. |
| 1912–1927 | Republic: faster than the state networks | Market flows accelerated, but the central state did not provide a single money, security and infrastructure standard. |
| 1928–1936 | Nanjing Decade: Short State Assembly | Investment and monetization accelerated, but the budget did not exceed about 8,8% GDP, and assets were concentrated on the coast. |
| 1937–1949 | War and hyperinflation: the destruction of capital and trust | The issue replaced the budget, the relocation replaced reproduction, and the military logic replaced investment. |
| 1949–1957 | Recovery and the Five-Year Plan | Production and human reserves were rapidly recovering; agriculture and consumption remained subservient to heavy industry. |
| 1958–1962 | Big jump: goal without feedback | Poor data validation and suppressed feedback have made planned acceleration a source of systemic damage. |
| 1963–1965 | Correction: V-shaped recovery | Proportions and incentives restored the flow without changing the political regime. |
| 1966–1978 | Fortress balance and strategic capacities | Autonomy and heavy infrastructure increased; services, labor mobility, and critical scientific environments lagged behind. |
| 1978–1991 | Reforms: Release of Hidden Productivity | The main resource is not new capital, but the removal of administrative blockages from labor, agricultural surplus and local initiative. |
| 1992–2001 | Institutional assembly before the WTO | Market institutions and infrastructure have prepared an export push; the price is layoffs, the regional gap and weak social protection. |
| 2001–2008 | WTO and Export-Investment Supercycle | The surpluses increased the external buffer, but low consumption and emissions carried some of the costs into the future and beyond the balance sheet. |
| 2009–2019 | Credit, infrastructure and digital platforms | Infrastructure has become a real asset; local debt and real estate a deferred liability. |
| 2020–2026 | Technological Maximum and Reproduction Deficit | Manufacturing and technology stock is record; bottlenecks are population, domestic demand, housing, debt, and household confidence. |
Periodization is authorial; actual supports are given on subsequent pages.
Source: World Bank WDI [S08] Urbanization schedule is used for continuity WDI/UN; official NBS 2025 — 67,89%.
China: 1896–1911 — Late Qing: modernization without sovereign control
| Railways and new schools grew, but graduation per capita and manageability did not keep pace with demographics and external obligations. |
|---|
| Indicator | Value | Period / Perimeter | Source |
|---|---|---|---|
| Population | 400,0 → 427,7 million | 1900–1911; +6,9% | [S01] |
| Real GDP | 388,8 → 387,0 billion intl$ 2011 | 1900–1911; −0,5% | [S01] |
| GDP per capita | 972 → 905 intl$ 2011 | −6,9% | [S01] |
| Railways | ≈9,4 thousand km | 1911; only ≈20% under Chinese control | [S01] |
| New schools | <7 thousands. → 1,6 Millions of students | 1902–1909; ≈59 Thousands of schools | [S01] |
| Boxer indemnity | 450 million Haiguanese lan | 4% per annum, 39 years | [S01] |
Numbers are control points; boundaries and techniques are given in the third column.
Diagnosis EQUILIBRIUM
Stocks of knowledge and infrastructure arose, but external dependence and low fiscal capacity did not allow them to turn into mass income.
Meaning
Sovereignty without a mechanism for coordinating capital, territory and information remained declarative.
China: 1912–1927 — Republic: faster than the state networks
| Port cities, banks, schools and private industry developed with political fragmentation. |
|---|
| Indicator | Value | Period / Perimeter | Source |
|---|---|---|---|
| Population | 437,1 → 487,3 million | Nearest points 1913–1929 | [S01] |
| Real GDP | 430,6 → 488,7 billion intl$ | +13,5% | [S01] |
| GDP per capita | 985 → 1 003 intl$ | +1,8% | [S01] |
| Railways | ≈8 → 12 thousands of km | 1912–1927 | [S01] |
| Students | ≈3 → almost 7 million | 1912–1922 | [S01] |
| Modern industry | ≈+13,8% per year | 1912–1920, with very low base | [S01] |
Numbers are control points; boundaries and techniques are given in the third column.
Diagnosis EQUILIBRIUM
Market flows accelerated, but the central state did not provide a single money, security and infrastructure standard.
Meaning
The economic network is able to live at a weak center - but almost unable to amortize war and systemic shock.
China: 1928–1936 - Nanjing Decade: Short State Assembly
| National finance, scientific institutions and transport for the first time began to form a single contour. |
|---|
| Indicator | Value | Period / Perimeter | Source |
|---|---|---|---|
| Population | 487,3 → 508,0 million | 1929–1936 | [S01] |
| Real GDP | 488,7 → 541,0 billion intl$ | +10,7% | [S01] |
| GDP per capita | 1 003 → 1 065 intl$ | +6,2% | [S01] |
| Modern industry | ≈2% GDP | 1933; island in agrarian economy | [S01] |
| Students | ≈20 million | 1936; primary and secondary schools | [S01] |
| Academia Sinica | founded in 1928 | 15 seasons of Yinshuya excavations up to 1937 | [S30] |
Numbers are control points; boundaries and techniques are given in the third column.
Diagnosis EQUILIBRIUM
Investment and monetization accelerated, but the budget did not exceed about 8,8% GDP, and assets were concentrated on the coast.
Meaning
Institutions began to synchronize knowledge and the state; the margin of safety was less than the external threat.
China: 1937–1949 - War and hyperinflation: the destruction of capital and trust
| The military and civil divide have simultaneously destroyed physical assets, human capital and monetary coordination. |
|---|
| Indicator | Value | Period / Perimeter | Source |
|---|---|---|---|
| Population | 510,6 → 541,7 million | 1937–1949 | [S01] |
| GDP per capita | 1 034 → 799 intl$ | 1937–1950; −22,7% | [S01] |
| Total GDP | ≈−17,3% | 1937–1950 | [S01] |
| Losses of War | ≈15 Millions of dead | 60–95 million refugees; academic estimates | [S01] |
| Working Railways | ≈11 thousand km | from 21,8 thousand km laid to 1949 | [S01] |
| Price level | ≈×36 trillion prewar | May 1949; Bank of China retrospective | [S31] |
Numbers are control points; boundaries and techniques are given in the third column.
Diagnosis EQUILIBRIUM
The issue replaced the budget, the relocation replaced reproduction, and the military logic replaced investment.
Meaning
Hyperinflation has turned the military deficit into a crisis of legitimacy: without trust, cash flow ceases to coordinate exchange.
China: 1949–1957 - Recovery and Five-Year Plan
| The industrial framework was created faster than consumer, but the restoration of health and basic production was real. |
|---|
| Indicator | Value | Period / Perimeter | Source |
|---|---|---|---|
| Population | 541,7 → 646,5 million | +19,4% | [S04] |
| Real GDP | ≈+9,27% per year | 1953–1957; +55,8% cumulative | [S03] |
| Industry | ≈+19,7% per year | I five-year plan | [S03] |
| Coal | 32 → 131 million tons | 1949–1957 | [S05] |
| Electricity | 4,3 → 19,3 TWT·h | 1949–1957 | [S05] |
| Steel | 0,158 → 5,35 million tons | 1949–1957 | [S05] |
Numbers are control points; boundaries and techniques are given in the third column.
Diagnosis EQUILIBRIUM
Production and human reserves were rapidly recovering; agriculture and consumption remained subservient to heavy industry.
Meaning
Centralization proved to be effective for the collection of basic capital, but laid the risk of a single plan error.
China: 1958–1962 — Big jump: goal without feedback
| The mobilization of heavy industry has destroyed the food, demographic and information balance. |
|---|
| Indicator | Value | Period / Perimeter | Source |
|---|---|---|---|
| Real GDP | −9,3% to the level 1957 | 1958–1962; after +21,3% in 1958 | [S03] |
| Grain | ≈200 → 143,5 million tons | 1958–1960; ≈−28% | [S32] |
| Grain for the soul | 306 → 240 kg | 1957–1962 | [S32] |
| Mortality | 25,4‰ | 1960; official series | [S04] |
| Population | 662,1 → 658,6 million | 1960–1961; −3,48 million | [S04] |
| Excess deaths | ≈16,5–30 million | Academic Range | [S32] |
Numbers are control points; boundaries and techniques are given in the third column.
Diagnosis EQUILIBRIUM
Poor data validation and suppressed feedback have made planned acceleration a source of systemic damage.
Meaning
EQUILIBRIUM requires the right of reality to abolish a political goal; without this power turns into the destruction of reproduction.
China: 1963–1965 — Correction: V-shaped recovery
| The return of agricultural incentives and industry proportions has shown the value of adaptability even within the planned system. |
|---|
| Indicator | Value | Period / Perimeter | Source |
|---|---|---|---|
| Real GDP | ≈+15,1% per year | 1963–1965; +52,5% cumulative | [S03] |
| Sector A/L/H | 37,3 / 32,3 / 30,4% | 1965 vs 21,8 / 26,1 / 52,1% vs 1960 | [S03] |
| Steel | 6,67 → 12,23 million tons | 1962–1965 | [S05] |
| Electricity | 45,8 → 67,6 TWT·h | 1962–1965 | [S05] |
| Grain for the soul | 240 → 272 kg | 1962–1965 | [S32] |
| Oil | 5,75 → 11,31 million tons | 1962–1965 | [S05] |
Numbers are control points; boundaries and techniques are given in the third column.
Diagnosis EQUILIBRIUM
Proportions and incentives restored the flow without changing the political regime.
Meaning
Sustainability is not determined by the absence of errors, but by the speed of recognizing the error and restoring feedback.
China: 1966–1978 — Fortress balance and strategic capabilities
| Energy, oil and defense science grew with almost frozen urbanization and damaged academic staff reproduction. |
|---|
| Indicator | Value | Period / Perimeter | Source |
|---|---|---|---|
| Real GDP | ≈+6,25% per year | 1966–1978; with recessions 1967, 1968, 1976 | [S03] |
| Population | 725,4 → 962,6 million | +32,7% | [S04] |
| Urbanization | 17,98% → 17,92% | 1965–1978; almost no shift | [S04] |
| Energy | 188 → 628 million t. | 1965–1978; ×3,34 | [S05] |
| Oil | 11,3 → 104,1 million tons | 1965–1978; ×9,2 | [S05] |
| Electricity | 67,6 → 256,6 TWT·h | 1965–1978; ×3,8 | [S05] |
Numbers are control points; boundaries and techniques are given in the third column.
Diagnosis EQUILIBRIUM
Autonomy and heavy infrastructure increased; services, labor mobility, and critical scientific environments lagged behind.
Meaning
CAS helped create the atomic bomb, satellite, synthetic insulin and other results, but could not compensate for the closure of universities and the destruction of verification.
China: 1978–1991 — Reforms: Release of Hidden Productivity
| Family contract, rural and settlement enterprises and FEZ have transferred labor to more productive contours without dismantling the state. |
|---|
| Indicator | Value | Period / Perimeter | Source |
|---|---|---|---|
| Real GDP | ≈+9,10% per year | 1979–1991 | [S08] |
| GDP | $0,150 → $0,385 trillion | 1978–1991, current dollars | [S08] |
| Population | 956 → 1 151 million | 1978–1991 | [S08] |
| Urbanization | 17,92% → 26,94% | 1978–1991 | [S08] |
| Turnover | $20,6 → $135,6 billion | 1978–1991 | [S06] |
| Reserves | $0,167 → $21,7 billion | 1978–1991 | [S06] |
Numbers are control points; boundaries and techniques are given in the third column.
Diagnosis EQUILIBRIUM
The main resource is not new capital, but the removal of administrative blockages from labor, agricultural surplus and local initiative.
Meaning
The reform showed that a combination of the market and the strategic state can increase the flow without instantaneous loss of controllability.
China: 1992–2001 - Institutional assembly before the WTO
| The market has become the main mechanism of allocation, and the state has retained control over finances, land and command heights. |
|---|
| Indicator | Value | Period / Perimeter | Source |
|---|---|---|---|
| Real GDP | ≈+10,42% per year | 1992–2001 | [S08] |
| GDP | $0,385 → $1,355 trillion | Current dollars | [S08] |
| Share of world GDP | 1,60% → 4,02% | Denomination | [S08] |
| Urbanization | 26,94% → 37,66% | 1991–2001 | [S08] |
| Turnover | $509,8 billion | 2001 | [S06] |
| R & D | 0,93% GDP | 2001 | [S08] |
Numbers are control points; boundaries and techniques are given in the third column.
Diagnosis EQUILIBRIUM
Market institutions and infrastructure have prepared an export push; the price is layoffs, the regional gap and weak social protection.
Meaning
By the time China joined the WTO, it was already a system of market coordination and long-term state capital, not just a “cheap factory.”
China: 2001–2008 - WTO and Export-Investment Supercycle
| The maximum external efficiency has given reserves and technologies, while increasing dependence on demand and environmental burden. |
|---|
| Indicator | Value | Period / Perimeter | Source |
|---|---|---|---|
| Real GDP | ≈+11,06% per year | 2002–2008 | [S08] |
| GDP | $1,355 → $4,667 trillion | 2001–2008 | [S08] |
| Trade | 38,1% → 56,7% GDP | Peak External Dependency | [S08] |
| Current account | 1,28% → 9,01% GDP | 2001–2008 | [S08] |
| Reserves | $212 billion → $1,946 trillion | 2001–2008 | [S08] |
| CO₂ | 3,72 → 7,49 Gt | 2001–2008 | [S29] |
Numbers are control points; boundaries and techniques are given in the third column.
Diagnosis EQUILIBRIUM
The surpluses increased the external buffer, but low consumption and emissions carried some of the costs into the future and beyond the balance sheet.
Meaning
External demand is able to accelerate modernization, but does not replace internal reproduction of income and environment.
China: 2009–2019 — Credit, infrastructure and digital platforms
| After the crisis, the external imbalance decreased, but its place was taken by domestic credit, land and real estate. |
|---|
| Indicator | Value | Period / Perimeter | Source |
|---|---|---|---|
| Real GDP | ≈+7,82% per year | 2009–2019 | [S08] |
| GDP | $4,667 → $14,56 trillion | 2008–2019 | [S08] |
| Share of the world | 7,25% → 16,40% | Nominal GDP | [S08] |
| Trade | 56,7% → 35,45% GDP | External macro-dependence has decreased | [S08] |
| R & D | 2,20% GDP | 2019 | [S07] |
| VSM | ≈35 thousand km | 2019 | [S07] |
Numbers are control points; boundaries and techniques are given in the third column.
Diagnosis EQUILIBRIUM
Infrastructure has become a real asset; local debt and real estate a deferred liability.
Meaning
China has moved from export dependence to domestic investment, while maintaining a high capacity for execution.
China: 2020–2026 — Technological maximum and reproduction deficit
| China’s weakness is not the ability to produce, but the ability to turn production into sustainable domestic well-being. |
|---|
| Indicator | Value | Period / Perimeter | Source |
|---|---|---|---|
| GDP | 140,19 trillion RMB / $19,50 trillion | 2025; real growth +5,0% | [S02] |
| Population | 1 404,89 million; −3,39 million per year | 2025; birth rate 7,92 million | [S02] |
| Urbanization | 67,89% | 2025, definition NBS | [S02] |
| Turnover | $6,355 trillion | Exports $3,772 trillion; Surplus $1,189 trillion | [S02] |
| R & D | 3,926 trillion RMB; 2,80% GDP | 2025; basic science 7,08% R&D | [S02] |
| Generation | 10 575 TWT·h; clean 40,2% | 2025; Power 3,891 TW | [S02] |
Numbers are control points; boundaries and techniques are given in the third column.
Diagnosis EQUILIBRIUM
Manufacturing and technology stock is record; bottlenecks are population, domestic demand, housing, debt, and household confidence.
Meaning
The next stage requires shifting the center of gravity from “investment + exports” to income, social protection and productivity.
China: what the Academy of Sciences has changed
| 1949 Establishment of CAS Strategic Expert Center | >1 600 Research institutions in the middle 1960- Oh, the whole system | 78 thousand international PCT-applications 2025, order of magnitude | 2,80% R&D / GDP 2025 |
|---|
The Chinese Academy of Sciences has been particularly strong as an integrator of strategic tasks: fundamental physics, atomic and space programs, materials, biology, geology, and expert support for industrial policy. Its contribution was not to “create GDP in general” but to reduce the uncertainty and time between task, research, prototype, and scaling.
- Strong institutional linkage: strategic challenge → academic institute → engineering circuit → industrial scaling.
- The verifiable symbolic results of the Maoist period: the atomic bomb (1964), Crystalline insulin (1965), The hydrogen bomb (1967), satellite (1970), hybrid rice and artemisinin.
- The main limit: the Academy cannot replace true statistics, autonomous verification and reproduction of personnel. The closure of universities and violations of 1966–1970 years showed this boundary.
- Modern challenge: the share of basic research — 7,08% R & D 2025 year; an increase in the overall budget does not automatically mean an adequate supply of open basic science.
| The Academy increases strategic autonomy when embedded in the contour of task setting and implementation; it retains EQUILIBRIUM only with independent verification and long personnel reproduction. |
|---|
USA: map of 130-year transition
| Period | Mechanism | Balance sheet |
|---|---|---|
| 1896–1916 | Mass production and the national market | Industrial scale, immigration and national networks have created a flow faster than social protection and financial supervision. |
| 1917–1929 | Electrification, consumer credit and vulnerability | Electricity and mass consumption increased productivity; the credit superstructure became a source of instability. |
| 1929–1945 | Depression, New Deal and Mobilization | The state became the balancer of last resort; military mobilization restored output, but through emergency mode and debt. |
| 1945–1971 | Wide post-war EQUILIBRIUM | Productivity growth, mass education, infrastructure, science, and income distribution were synchronized better than in subsequent periods. |
| 1971–2000 | Dollar, financial and digital networks | After the abandonment of gold, trust was monetized through the dollar, capital markets, technology, and regulations; production gradually lost relative weight. |
| 2001–2019 | Global Option and Financial Leverage Price | The dollar, technology, and markets allowed the deficit to be financed; the crisis of 2008 showed the price of separating financial flows from asset quality. |
| 2020–2026 | Energy and scientific power in debt and aging | US preserves advanced science, energy, capital, and networks; constraints include debt, uneven infrastructure, aging, and rapid growth in energy demand AI. |
Periodization is authorial; the ranks of population, education, R&D, energy, and debt have different sources.
USA: 1896–1916 — Mass production and national market
| Industrial scale, immigration and national networks have created a flow faster than social protection and financial supervision. |
|---|
| Indicator | Value | Period / Perimeter | Source |
|---|---|---|---|
| Population | 76,2 → 92,2 million | 1900–1910 | [S12] |
| Urban share | 39,6% → 45,6% | 1900–1910 | [S12] |
| Share of world GDP | ≈16% | 1900, reconstruction | [S01] |
| Secondary school | 13.5% completed | 1910 | [S15] |
| Bachelor | 2,7% | 1910 | [S15] |
| Institutions | FRS 1913; NACA 1915 | Coordination of Money and Aviation Science | [S14] |
Numbers are control points; boundaries and techniques are given in the third column.
Diagnosis EQUILIBRIUM
Industrial scale, immigration and national networks have created a flow faster than social protection and financial supervision.
USA: 1917–1929 - Electrification, consumer credit and vulnerability
| Electricity and mass consumption increased productivity; the credit superstructure became a source of instability. |
|---|
| Indicator | Value | Period / Perimeter | Source |
|---|---|---|---|
| Population | 106 million | 1920 | [S12] |
| Urban share | 51,2% | 1920 | [S12] |
| Nominal GDP | $104,6 billion | 1929 | [S13] |
| New infrastructure | car, radio, power grid | mass diffusion 1920s | [S13] |
| Credit | Fast expansion | consumption and securities | [S14] |
| Financial summary | Crash 1929 | Overestimated risk and weak protection | [S14] |
Numbers are control points; boundaries and techniques are given in the third column.
Diagnosis EQUILIBRIUM
Electricity and mass consumption increased productivity; the credit superstructure became a source of instability.
USA: 1929–1945 — Depression, New Deal, and Mobilization
| The state became the balancer of last resort; military mobilization restored output, but through emergency mode and debt. |
|---|
| Indicator | Value | Period / Perimeter | Source |
|---|---|---|---|
| Real Issue | ≈−30% | 1929–1933 | [S13] |
| Unemployment | ≈25% | the Great Depression Peak | [S14] |
| Population | 132,2 million | 1940 | [S12] |
| Urban share | 56,5% | 1940 | [S12] |
| Secondary school | 24.5% completed | 1940 | [S15] |
| Federal debt | 114,1% GDP | 1945 | [S17] |
Numbers are control points; boundaries and techniques are given in the third column.
Diagnosis EQUILIBRIUM
The state became the balancer of last resort; military mobilization restored output, but through emergency mode and debt.
USA: 1945–1971 — Wide post-war EQUILIBRIUM
| Productivity growth, mass education, infrastructure, science, and income distribution have been synchronized better than in subsequent periods. |
|---|
| Indicator | Value | Period / Perimeter | Source |
|---|---|---|---|
| Population | 151,3 → 203,2 million | 1950–1970 | [S12] |
| Urban share | 64,0% → 73,6% | 1950–1970 | [S12] |
| Electricity | 334 → 1 535 TWT·h | 1950–1970 | [S18] |
| R & D | 1,33% → 2,45% GDP | 1953–1970; peak 2,79% at 1964 | [S16] |
| Debt | 85,7% → 35,5% GDP | 1948–1970 | [S17] |
| Institutions | NSF 1950; NASA and DARPA 1958 | Federal Science and Procurement | [S16] |
Numbers are control points; boundaries and techniques are given in the third column.
Diagnosis EQUILIBRIUM
Productivity growth, mass education, infrastructure, science, and income distribution were synchronized better than in subsequent periods.
USA: 1971–2000 — Dollar, financial and digital networks
| After the abandonment of gold, confidence was monetized through the dollar, capital markets, technology, and regulations; production gradually lost relative weight. |
|---|
| Indicator | Value | Period / Perimeter | Source |
|---|---|---|---|
| Population | 203,2 → 281,4 million | 1970–2000 | [S12] |
| Urban share | 73,6% → 79,0% | 1970–2000 | [S12] |
| Electricity | 1 535 → 3 802 TWT·h | 1970–2000 | [S18] |
| R & D | 2,45% → 2,61% GDP | 1970–2000 | [S16] |
| Debt | 35,5% → 54,9% GDP | 1970–2000 | [S17] |
| Bachelor | 11,0% → 25,6% | 1970–2000 | [S15] |
Numbers are control points; boundaries and techniques are given in the third column.
Diagnosis EQUILIBRIUM
After the abandonment of gold, trust was monetized through the dollar, capital markets, technology, and regulations; production gradually lost relative weight.
USA: 2001–2019 — Global optionality and the price of financial leverage
| The dollar, technology, and markets were able to finance the deficit; the crisis of 2008 showed the price of separating financial flows from asset quality. |
|---|
| Indicator | Value | Period / Perimeter | Source |
|---|---|---|---|
| Population | 281,4 → 328 million | 2000–2019 | [S12] |
| Federal debt | 54,5% → 105,2% GDP | 2001–2019 | [S17] |
| R & D | 2,63% → 3,09% GDP | 2001–2019 | [S16] |
| Current account | −6,2% GDP | 2006, maximum deficit | [S13] |
| Electricity | ≈4 PWT·h | 2019, order of magnitude | [S18] |
| Manufacturing industry | ≈10–12% GDP | end of period | [S13] |
Numbers are control points; boundaries and techniques are given in the third column.
Diagnosis EQUILIBRIUM
The dollar, technology, and markets allowed the deficit to be financed; the crisis of 2008 showed the price of separating financial flows from asset quality.
USA: 2020–2026 - Energy and scientific power in debt and aging
| US preserves advanced science, energy, capital, and networks; constraints include debt, uneven infrastructure, aging, and rapid growth in energy demand AI. |
|---|
| Indicator | Value | Period / Perimeter | Source |
|---|---|---|---|
| Population | 331,45 → 341,78 million | 2020–2025 | [S34] |
| 65+ | ≈61,2 million; about 18% | 2024 | [S12] |
| Electricity | ≈4,43 PWT·h | 2025 | [S18] |
| R & D | $1,009 trillion by PPP; 3,44% GDP | 2024 | [S16] |
| Federal debt | ≈121,5% GDP | 2025 | [S17] |
| Dollars in Reserves | ≈57% | 2026Q1, IMF COFER | [S13] |
Numbers are control points; boundaries and techniques are given in the third column.
Diagnosis EQUILIBRIUM
US preserves advanced science, energy, capital, and networks; constraints include debt, uneven infrastructure, aging, and rapid growth in energy demand AI.
USA: scientific and innovative contour
| ≈$1,009 trillion PPP R & D costs 2024 | 3,44% R&D / GDP 2024 | 29% World R&D 2024 | 1950/1958 NSF / NASA and DARPA institutional anchors |
|---|
The American model is not one “academy”, but a distributed ecosystem: federal agencies formulate missions and purchase results; universities produce fundamental knowledge and personnel; entrepreneurs and the capital market scale; standards and allied networks expand the foreign market.
- The advantage is a high innovative option: a lot of parallel experiments and a quick transfer of a successful solution to capital and standards.
- Vulnerability is the separation of financial valuation from the quality of a physical asset, demonstrated by the crisis of 2008.
- A new balance sheet challenge is the energy intensity of computing and AI: scientific flow is growing, but requires power grids, generation, water, personnel and local consent.
- Federal debt raises the cost of choice: innovative and defense commitments compete with debt service and an aging population.
Three Powers: The Scale That Makes Coordination Systemic
Source: World BankS19–S21] Nominal GDP — $52,829 trillion, or 44,6% world; PPP amount — $79,265 trillion, or about 37,5% World.
| Contour | Amount of three countries | Share of the world | Date | Source |
|---|---|---|---|---|
| Nominal GDP | $52,829 trillion | 44,6% World | 2025 | [S19–S20] |
| GDP by PPP | $79,265 trillion | ≈37,5% World | 2025 | [S21] |
| Population | ≈1,892 billion | ≈23% World | 2025 | [S19] |
| Military expenditures | $1,480 trillion | ≈51% World | 2025 | [S22] |
| Territorial CO₂ | ≈18,96 Gt | ≈49,2% World | 2024 | [S29] |
| Primary energy | ≈304,5 EJ | ≈49% World | 2024, rating | [S28] |
| Foreign trade turnover | ≈$12,3 trillion | ≈25% world turnover | 2024, gross | [S26–S27] |
Trade turnover counts exports and imports and therefore contains a double bill. The energy estimate depends on the substitution method.
Meanings of three systems: not character, but an optimized function
| System | What optimizes | Strong sense | Risk |
|---|---|---|---|
| China | Scope and coordination | Sovereignty through organized development and material reproduction. | Investments outpace revenues, demographics, ecology, and feedback. |
| USA | Optionality and Networks | Freedom of action through innovation, capital, standards and allied networks. | Financial and technological flows break away from industrial and social reproduction. |
| Russia | Autonomy and Survival | Sovereignty through resource depth and the ability to withstand prolonged shock. | Defense and raw materials stocks dominate diversified civilian flows. |
Analytical ideal types; not a statement of a fixed national character.
| The total EQUILIBRIUM occurs when Chinese scale, American option, and Russian resilience cease to mutually destroy each other. |
|---|
| Contour | USA | China | Russia | Synergy |
|---|---|---|---|---|
| Science and technology | Advanced Research, Software, Capital | Engineering Iteration and Scaling | Fundamental school, atom, space | Idea → prototype → mass system |
| Production | Capital-intensive high technologies | Completeness of chains and scale | Materials, energy, heavy engineering | Low Price + Backup |
| Energy and climate | Technology, Finance, Market | The largest electric power industry and cleantech | Resources, Atom, Arctic | Standards for networks, atom and methane |
| Global risks | Calculations, satellites, epidemiology | Scale of implementation and production | Strategic stability, the Arctic | Public goods outside a lone power |
The benefits of synchronization: model and formulas
| Synchronization is not a union, not a single currency and not the removal of all restrictions. This is a limited, verifiable compatibility in projects where the public result is higher than the cost of dependency. |
|---|
The basic economy of the three countries in 2025 the Year Y₂₅ = $52,829 trillion With real growth 2,2% Conditional scale per year 2035 years Y₃₅ = $65,672 trillion The net effect in 2035 the Year:
Net₃₅ = F + 0,8 × (EL + S) + D − C
| Component | Formula | Low/Basic/High | Logic |
|---|---|---|---|
| F - Prevented fragmentation | Y₃₅ × f | 0,5% / 1,2% / 2,5% | Calibration within the range IMF 0,2–almost 7% World Edition. |
| EL - Trade and Logistics | T×a×c×0,5 + 5%Y₂₅×e | a=40/50/60%; c=2/4/6%; e=1/3/5% | T≈$12,3 trillion; 0,5 removes double import/export account. |
| S - Scientific diffusion | R×q×m | q=5/10/15%; m=25/50/75% | R≈$1,52 trillion R&D; win only on compatible circuit. |
| D - less security duplication | M×d×0,5 | d=2/6/12% | M=$1,48 trillion; only half is considered as a productive equivalent. |
| C - coordination costs | Y₃₅×k | 0,05/0,08/0,12% | Verification, adaptation, cybersecurity, compensation, reservation. |
| 20%th Deduction of Overlays | 0,8×(EL+S) | Single for three scenarios | It is impossible to calculate trade and scientific productivity twice. |
Parameters are the author's scenario assumptions; external sources only specify the order of the bases and the permissible range of damage.
How much synchronization
Author's model. Structural Scenarios - Effect to 2035; Conservative Cut - Independent verification of sustainable annual effect.
| Scenario | Clean / year | NPV 2026–2035 | Before the overlaps | Interpretation |
|---|---|---|---|---|
| Low | $0,386 trillion | $1,73 trillion | $0,405 trillion | Limited standards, security, separate logistics |
| Basic | $1,001 trillion | $4,49 trillion | $1,058 trillion | Functional synchronization; recommended reference point |
| High | $2,072 trillion | $9,29 trillion | $2,176 trillion | Wide discharge; high political and dependency price |
| Conservative Review | ≈$0,600 trillion | ≈$4,02 trillion | — | Other base and parameters; 3-year phase, rate 4% |
| Strict verification | $0,779 trillion | — | — | Basic scenario without EL and S — only F + D − C |
NPV of the structural model: linear effect growth from 10% to 100%, real rate 3%; coefficient 4,4839.
Basic scenario: F=$0,788 trillion; EL=$0,202 trillion and S=$0,076 trillion to 20%- his deduction; D=$0,044 trillion; C=$0,053 trillion
| The central plausible dividend is approximately $0,6–1,0 trillion per year and $4,0–4,5 trillion NPV the National Park 2026–2035. Wide scenario range — $0,36–2,07 trillion per year. This is not a budget income or a guarantee. |
|---|
What is not monetized
| Risk | Synchronization mechanism | Why is important | How to count |
|---|---|---|---|
| Nuclear escalation | Hotlines, notifications, rules AI and human solution | Expected damage = probability × catastrophic cost; parameters are unreliable | Show separately, do not add to GDP |
| Climate and methane | Compatible measurements, satellite verification, leakage standards | Three countries ≈49% Territorial CO₂ | Count by Prevented Tons and Local Health |
| Pandemics | Early warning, sample libraries, backup power | Rare but global systemic damage | Time-Scenarios for Vaccine Detection and Release |
| Technological accident | Common incident protocols AI, space and cyber systems | High uncertainty and dual purpose | Limit the contour, measure the recovery time |
New START expired in February 2026; SIPRI highlights the rise in nuclear uncertainty [S23].
IMF Assesses long-term losses from geo-economic fragmentation in the range 0,2% — almost 7% technological gap for individual countries - up to 12% GDP. WTO It shows almost 7% long-term loss of world GDP in a rigid two-block scenario. These estimates set the upper frame, but do not mean that tripartite coordination automatically prevents all damageS24–S25]
Secure Synchronization Architecture
| Contour | Minimum subject |
|---|---|
| 1. Strategic sustainability | Hotlines; notifications of exercises and launches; rules of conduct in space and cyberspace; a mandatory human solution in the nuclear circuit. |
| 2. Reproduction | Climate and methane; pandemics; food; Arctic; fundamental science; civil nuclear energy. |
| 3. Compatibility | Metrology; technical standards; emergency logistics; insurance and payments for permitted projects - without a single currency and political union. |
Protective conditions
- The narrow subject of each agreement and the symmetry of the test result.
- Common basic data set, independent verification and public methodology.
- Step-by-step reversible pilots; automatic review or suspension in case of violation.
- Preservation of the original intellectual property and pre-defined mode of project IP.
- Civil-military firewall, export control and prohibition of transfer to agreed military categories.
- Diversification of critical supplies: Cooperation should not create monopoly dependence.
- Openness to third countries following the same rules; absence of a closed “directorate of three”.
- Distribution of benefit by proven contribution and prevented damage, not just by political weight.
- Ladder disputes: Technical group → independent examination → political level → proportional suspension.
Scripts 2026–2035
| Scenario | What is synchronised | Economic result | Equilibrium |
|---|---|---|---|
| Block fragmentation | Only emergency contacts | Duplication of capacities, expensive standards and logistics | Local autonomy ↑; global externalities dramatically worse |
| Managed Rivalry | Nuclear incidents, epidemics, selected climate data | Small direct benefit, large optional value | The main benefit is less probability of disaster |
| Functional Synchronization | Security + Science + Energy + Methane + Standards + Logistic permitted | ≈$0,6–1,0 trillion/year as central range | The best realistic balance of autonomy and overall result |
| Strategic détente | Broad markets, institutions and arms control | Up to the top of the model range | Maximum gross benefit but high risk of new addiction |
| The third scenario is the most stable: cooperation where the result is measurable, dependence is limited, violation is detectable, and the output is reversible. |
|---|
Conclusions
| 01 EQUILIBRIUM — Reproduction without the accumulation of irreversible debts. |
|---|
| 02 For 130 years, the three powers have been breaking down not from lack of power, but from the gap between growth, feedback, and reproduction. |
|---|
| 03 China has turned scale into production capacity; the new deficit is demographics, household incomes, and confidence in the future. |
|---|
| 04 The United States has transformed innovation, capital and standards into global flows; the weak point is social and infrastructure reproducibility. |
|---|
| 05 Russia has retained strategic reserves and autonomy; the bottleneck is their transformation into diversified civil flows. |
|---|
| 06 1991–2008 The years were not a harmony, but an unmanageable triangular synchronization of demand, production, and resources. |
|---|
| 07 Breaking ties increases the autonomy of individual circuits, but multiplies duplication, cost of standards, and externalities. |
|---|
| 08 Complete integration is unrealistic; modular synchronization of measurable public goods is realistic. |
|---|
| 09 The central cash dividend is about $0,6–1,0 trillion Strategic benefits of reducing tail risks may be greater, but not honestly monetized. |
|---|
| 10 Success is measured by recovery time, capital renewal, and benefit sharing — not by the number of agreements signed. |
|---|
Annex A. Verification of model arithmetic
| Variable | Value | Verification |
|---|---|---|
| Y₂₅ | $52,829 trillion | 30,770 + 19,498 + 2,561 |
| Y₃₅ | $65,672 trillion | 52,829 × 1,022¹⁰ |
| Trade Base T | $12,3 trillion | gross export+import; double count factor 0,5 |
| R&D Base R | $1,52 trillion | nominal approximation; do not mix with PPP-estimate NSF |
| Military Base M | $1,48 trillion | SIPRI 2025: 954 + 336 + 190 billion |
| Basic F | $0,788 trillion | 65,672 × 1,2% |
| Basic EL | $0,202 trillion | before subtracting the overlaps |
| Basic S | $0,076 trillion | before subtracting the overlaps |
| Base D | $0,044 trillion | 1,48 × 6% × 0,5 |
| Base C | $0,053 trillion | 65,672 × 0,08% |
| Basic Net | $1,001 trillion | 0,788 + 0,8×(0,202+0,076) + 0,044 − 0,053 |
| NPV | $4,49 trillion | Net × 4,4839; Linear phase, real rate 3% |
The rounding may give a difference in the last sign.
Annex B. Sources
Primary and authoritative sources. Date of access: 27 August 2026.
[S01] Maddison Project Database 2023: Historical GDP and Population
[S02] NBS China: Statistical communiqué for 2025
[S03] NBS China: GDP and real rates 1952–1978
[S04] NBS China: demographic retrospective
[S05] China Statistical Yearbook: Industrial Products
[S06] NBS China: foreign trade, historical series
[S07] NBS China: Statistical communiqué for 2019
[S08] World Bank WDI: China, macroeconomic indicators
[S09] IMF: China 2025 Article IV Consultation
[S10] CAS: official profile of the Chinese Academy of Sciences
[S11] WIPO: PCT Yearly Review 2026
[S12] U.S. Census Bureau: Historical Tables of Population and Urbanization
[S13] BEA: National Income and Product Accounts
[S14] Federal Reserve History: The Creation of the Fed and the Great Depression
[S15] U.S. Department of Education/NCES: Digest of Education Statistics
[S16] NSF/NCSES: R&D and research publications, 2024
[S17] U.S. Treasury/Fiscal Data: Federal Government Debt
[S18] EIA: Monthly Energy Review and Electricity Data
[S19] World Bank: comparison of the USA, China and Russia
[S20World Bank: Global GDP and the Three Powers
[S21] World Bank: PPP GDP
[S22] SIPRI: World military expenditures in 2025
[S23] SIPRI Yearbook 2026: Nuclear Weapons and the End of the New START
[S24] IMF: the range of losses from geoeconomic fragmentation
[S25] WTO: The scenario of dividing the world economy into two blocks
[S26] WTO: Global Trade Outlook and Statistics 2025
[S27] BEA: U.S. International Trade in Goods and Services, 2024
[S28] Energy Institute: Statistical Review of World Energy
[S29] Global Carbon Budget / Our World in Data: territorial emissions CO₂
[S30] Academia Sinica: Inshu's excavations
[S31] Bank of China: hyperinflation 1946–1949 years
[S32] PMC: Great Chinese Famine — Grain and Demographic Estimates
[S33] WIPO: World Intellectual Property Indicators 2025
[S34] U.S. Census Bureau: population clock/data
[S35] World Bank: Russia — macroeconomic profile
Annex C. Terms and reservations
| Term | Value |
|---|---|
| GDP by PPP | Estimation of output adjusted for differences in domestic prices. It is not a market value of assets or a foreign exchange resource. |
| Current dollars | Nominal conversion at the current rate; sensitive to currency and deflators. |
| International dollar 2011 | Maddison's historical reconstruction unit; does not mix with current dollars. |
| PPP R & D | Comparison of real research resources; not equal to nominal budget in dollars. |
| Scenario | Conditional calculation with given parameters. Not a promise, not a prediction, not a causal estimate. |
| NPV | The present value of the effect flow; depends on the implementation trajectory and discount rate. |
| Tail risk | A rare event with huge damage; the expected cost is extremely sensitive to probability. |
| Synchronization | Limited compatibility of data, standards, protocols and projects while maintaining political autonomy. |
End of document
Source materials
Originals and versions of the document
- Balansy_Kitaya_SSHA_1896-2026_Equilibrium_Sinhronizatsiya.docxDOCX · main document
- Balansy_Kitaya_SSHA_1896-2026_Equilibrium_Sinhronizatsiya.pptxPPTX · related version
Other editions in web format
Each version is disclosed separately; the sequence of the source document is saved.
EQUILIBRIUM Three PowersBalansy_Kitaya_SSHA_1896-2026_EQUILIBRIUM_Sinhronizatsiya.pptx · web text+
China and the United States in 130 years
$0,6–1,0
trillion PER YEAR
$4,0–4,5 trillion
Russia as the third circuit • 1896–2026
NPV 2026–2035
Balances • Meanings • Synchronization Benefits
The script,
not forecast
Prepared for Sokolov Sergey Leonidovich
27 August 2026
Synchronization is able to $0,6–1,0 trillion per year
SUMMARY FOR DECISIONS
$0,60 trillion
$1,00 trillion
$4,49 trillion
$0,36–2,07 trillion
Conservative Cut
base scenario
NPV
Wide Uncertainty
sustainable annual effect
Effect to 2035
2026–2035, rate 3%
Low - High Scenario
This is not a union, not a budget income or a forecast. This is a scenario assessment of the prevented losses and compatible efficiency.
The main monetary channel is less fragmentation of standards, trade, energy and science.
Nuclear, climate and pandemic tail risk are not included.
The realistic format is modular, testable and reversible synchronization.
EQUILIBRIUM - reproduction without irreversible debts
CONCEPT
Not equality of forces. Not the absence of conflict. Not a maximum release.
REPRODUCTION + ΔRESERVES
AMORTIZATION + HUERB + DEPENDENT RISK
Growth is sustainable only if it does not deplete people, infrastructure, nature, trust and security.
Index E is the geometric mean of the six axes: a strong measurement cannot completely hide the failure of a weak one.
Six axes separate balance from growth illusion
RUBRIC
RESERVES
FLOWS
REPRODUCTION
Capital, resources, people, institutions
Revenue, Trade, Energy, Productivity
Demographics, health, education, research and development
SUSTAINABILITY
LEGALITY
EXTERNAL EFFECTS
Reserves, diversification, recovery time
Rules, trust, distribution, feedback
Emissions, risks, future liabilities
Rapid GDP can hide the depletion of the next cycle.
In 130 years, the three powers have built different power machines
COMPARATIVE LOGIC
CHINA
USA
RUSSIA
Scale
+
coordination
Optionality
+
Network
Autonomy
+
Survival Rate
RISK
RISK
RISK
Large scale error detected late
Financial Flows are Disrupted from Reproduction
Strategic reserves are poorly converted into civilian flows
EQUILIBRIUM occurs when these functions complement each other - without imposing a single model entirely.
1896–1949: China modernized faster than the state collected
CHINA • EARLY
1896–1911
1912–1927
1928–1936
1937–1949
Late Qing
Republic
Nanking
War
GDP/Soul 972→905; 9,4 thousand km railway; 1,6 Millions of new school students.
GDP/soul almost stood; w/d 8→12 thousand km; faster than the center.
GDP +10,7%; the Soul +6,2%; budget ≤8,8% GDP.
GDP/Soul −22,7%; ≈15 Millions of deaths; hyperinflation.
1900–1950: population +36,7%, Real GDP +12,4%, GDP per capita −17,8%.
Infrastructure and education grew from a low base.
Weak money, territory and taxes did not create a general outline.
War has destroyed capital; hyperinflation has destroyed trust.
1949–1978: Mobilization created power but damaged feedback
CHINA • MOBILIZATION CONTOUR
1949–1957
1958–1962
1963–1965
1966–1978
Recovery
Big Leap
Correction
Fortress balance
GDP +9,3%/year; industry ≈+19,7%; Steel 0,16→5,35 million tons.
GDP −9%; Grain −28%; mortality 25,4‰; 16,5–30 Millions of excess deaths.
GDP +15,1%/year; return of industry proportions; grain/soul 240→272 kg.
Energy ×3,3; Oil ×9,2; Urbanization ≈0 p.p.; higher education institutions violated.
CAS strengthened the atomic, space and biomedical contours - but could not replace truthful data and personnel reproduction.
The main lesson: the right of reality to cancel a political goal is a critical element of equilibrium.
1978–2001: Incentives turned numbers into productivity
CHINA • REFORMS
+9,1%/year
17,9% → 37,7%
$20,6 → $509,8 billion
Real GDP
Urbanization
Trade
1979–1991
1978–2001
1978–2001
The first source of the miracle is the removal of administrative blockages from labor and rural surplus.
The market has entered into a strong state.
FEZ and local enterprises have created a pilot circuit.
Price: layoffs, inequality, rip-off of the coast - inland areas.
2001–2019: external imbalance replaced by internal credit
CHINA • GLOBALIZATION AND INFRASTRUCTURE
2001–2008
2009–2019
WTO: Maximum external efficiency
Credit, infrastructure, platforms
GDP $1,36→4,67 trillion; Trade 38,1→56,7% GDP; current account 9,0%; Reserves $1,95 trillion; CO₂ ×2.
GDP $4,67→14,56 trillion; share of the world 7,25→16,40%; Trade has declined to 35,45% GDP; R & D 2,20%; VSM ≈35 thousands of km.
China has reduced external macro-dependence but has suffered some of the imbalance in real estate, land and debt of local structures.
Infrastructure is a real asset. Funding commitments are a deferred balance sheet.
2020–2026: China's main deficit is reproduction
CHINA • CURRENT
$19,50 trillion
−3,39 million
2,80% GDP
10 575 TWT·h
Nominal GDP
Population change
R & D
Generation
+5,0% the Real World 2025
2025; 7,92 million births
3,926 trillion RMB
40,2% net
| Contour | Fact 2025 | Balance signal |
|---|---|---|
| Trade | $6,355 trillion; Surplus $1,189 trillion | External competitiveness is high |
| Real estate | Investments −17,2% | The old investment machine is shrinking. |
| Reserves | $3,358 trillion | External buffer remains large |
| Demography | 65+ = 15,9% | The price of social protection and labor shortage is growing |
Next transition: investment + export → household income + social protection + productivity.
China's balance: coordination strong, feedback vulnerable
CHINA • RESULTS
| Axis | Strength Side | Limitation |
|---|---|---|
| Reserves | Industry, networks, infrastructure | Property and some debt overvalued |
| Streams | Export, electricity, scaling | Weak domestic demand |
| Reproduction | Education and R & D | Population reduction, ageing |
| Resilience | Reserves and chain completeness | Energy and trade external risks |
| Legality | Ability to execute | Late detection of scale error |
| External effects | Green Power | ≈12,3 Gt CO₂ in 2024 |
Weakness is not the ability to produce; weakness is the ability to turn production into sustainable well-being.
Academy Strengthens Sovereignty — But Doesn't Replace Verification
CHINA •
1949
>1 600
≈78 thousands.
7,08%
creation CAS
Research Institutes
PCT-applications
basic science
Strategic Expert Center
the whole system by the middle of the 1960s
2025, order of magnitude
share in R&D, 2025
Strong Linkage: Problem → Institute → engineering circuit → scaling.
Testable results: atom, satellite, insulin, hybrid rice, artemisinin.
The limits of the system were shown by the Cultural Revolution: the closure of universities damaged personnel reproduction.
The budget of science does not compensate for weak statistics and suppressed criticism.
1896–1945: US Connects Industry, Standards, and State Risk
USA • Early
1896–1916
1917–1929
1929–1945
Mass production
Electrification and credit
Balanced State
Population 76,2→92,2 million; urban 39,6→45,6%; Fed 1913; NACA 1915.
V 1920 Most of them became urban. GDP 1929 ≈$104,6 billion; Credit risk ahead of supervision.
Release −≈30%; Unemployment ≈25%; C 1945 Debt ≈115–118% GDP.
The market did not restore balance automatically: the New Deal and mobilization transferred systemic risk to the federal state.
Scale became a system only after institutions of money, standard, science, and last resort.
1945–1971: U.S. closest to broad equilibrium
USA • AFTER EQUILIBRIUM
151 → 203 million
334 → 1 535
1,33% → 2,45%
≈86% → ≈35%
population
electricity, TWt·h
R&D / GDP
Federal Debt/GDP
1950–1970
1950–1970
1953–1970; peak 2,79%
1950–1971
Mass education and housing expanded productivity and demand.
Federal missions generated NSF, NASA, DARPA and technology procurement.
Infrastructure and production grew with households.
The debt load was reduced against the background of an increase in nominal output.
Peak EQUILIBRIUM: Science, infrastructure, production, and mass demand reinforced each other.
1971–2000: Dollar and digital networks have expanded the space of choice
USA • NETWORK OPTIONALITY
203 → 281 million
1 535 → 3 802
11,0% → 25,6%
population
electricity, TWt·h
Bachelor and above
1970–2000
1970–2000
1970–2000
After abandoning gold convertibility, the U.S. monetized confidence in the dollar, capital markets, technology, and rules.
R&D held about 2,5–2,6% GDP.
Debt has risen from about 35% to 55% GDP.
Production gradually lost relative weight to finance, software and services.
Option has grown, but has become dependent on trust in rules and global networks.
2001–2019: flows remained, reproduction began to diverge
USA • GLOBAL DISBALANCES
54,5% → 105%
2,63% → 3,09%
−6,2% GDP
≈11% GDP
Federal Debt/GDP
R&D / GDP
Current Account
manufacturing
2001–2019
2001–2019
2006, maximum deficit
End of period, order
The dollar allowed to finance the deficit; the crisis of 2008 showed the price of hidden leverage and weak asset quality.
Platforms and intangible assets have enhanced global flows.
The growth in electricity demand has almost stopped, the infrastructure has aged unevenly.
Regional and social gaps undermined the overall contract.
2020–2026: US leadership remains strong, but becomes more expensive
USA • CURRENT
341,8 million
$1,009 trillion
≈4,43 PWT·h
≈121,5%
population
PPP R & D
utility-scale generation
Federal Debt/GDP
2025; 65+ ≈18,9%
2024; 3,44% GDP
2025; +Small Sun
2025
| Contour | Current Power | Current Limitation |
|---|---|---|
| Energy | >103 quads; oil 13,2 million b/d | Networks and local permissions |
| Science | 29% World R&D | Cost of calculations and personnel |
| Dollar | 57,13% Distributed reserves | Evaluative effects and geopolitics |
| External balance | Deficit −2,9% GDP, 2026Q1 | Dependence on external financing |
Strengths are energy and R&D; constraints are debt, aging, and infrastructure load AI.
U.S. Balance: Option is strong, horizons are weak
USA • FINAL
| Axis | Strength Side | Limitation |
|---|---|---|
| Reserves | Universities, capital, energy, technology | Uneven physical infrastructure |
| Streams | Dollar, data, finance, standards | Deficits and financial dependence |
| Reproduction | Immigration, education, research and development | Aging and high cost of services |
| Resilience | Alliances and diversification | Chain complexity and political polarization |
| Legality | Competition of Institutions | Difficulty of a long social contract |
| External effects | Innovative public goods | Military and financial extraterritoriality |
The U.S. is quickly creating options — but harder to turn them into a long-term public contract.
Russia adds autonomy, depth of resources and ability to withstand shock
RUSSIA • THIRD CONTOUR
1896–1917
1917–1991
1991–2026
The Russian Empire
USSR
Russian Federation
Modernization of railways, banks and science; social and managerial contours did not have time to stabilize the system.
The scientific and industry system created industrial, nuclear and space power; the adaptability of the civilian circuit lagged.
Resources, defense, and fundamental school support autonomy; demography and civil commercialization limit reproduction.
Strong function: strategic autonomy and resource sustainability. Narrowing: transforming stocks into diversified civilian flows.
In the trilateral model, Russia is not a “bridge”, but an independent outline of energy, materials, the Arctic and strategic stability.
Scale, optionality and autonomy can complement each other
MEANINGS
CHINA
USA
RUSSIA
Sovereignty through
Organized development
Freedom of action through
Innovation and Networks
Sovereignty through
Autonomy and depth
RISK
RISK
RISK
Investments outpace revenues, demographics and the environment
Financial options break away from physical reproduction
Defense and resource reserve dominates the civil flow
Not a single model - compatibility of functions.
The three powers concentrate almost half of the key global flows
MASSHTAB 2024–2025
$52,83 trillion
Nominal GDP
44,6% world, 2025
≈1,89 billion
population
≈23% World Peace, 2025
Even the narrow coordination of standards and risks has a global effect.
Different years and methods; shares are shown as an order of scale.
Complementarity exists, but only with limited dependence
MAP SYNERGY
| Contour | USA | China | Russia | Synergy |
|---|---|---|---|---|
| Science | Research, PO, capital | Scaling | Elementary School, Atom | Idea → system |
| Production | High technology | Completeness of chains | Materials and Energy | Price + reserve |
| Energy | Technology and Finance | Networks and cleantech | Resources, Atom, Arctic | Common standards |
| Global risks | Calculations and satellites | Scope of implementation | Strategic stability | Public goods |
Cooperation is useful where the result is checked, the dependence is limited, the violation is detectable, and the output is reversible.
Dividend creates four channels - and reduces two amendments
MODEL
Net₃₅ = F + 0,8 × (EL + S) + D − C
F: Prevented fragmentation
EL: Trade and Logistics
S: scientific diffusion
D: Less conflict duplication
C: Verification, adaptation, compensation
0,8: EL and S overlap deduction
Baseline: $1,001 trillion in 2035.
The basic effect of c 2035 The year - about $1 trillion Annually
SCENARIUM AND VERIFICATION
| Scenario | Year | NPV 2026–35 |
|---|---|---|
| Low | $0,386 trillion | $1,73 trillion |
| Basic | $1,001 trillion | $4,49 trillion |
| High | $2,072 trillion | $9,29 trillion |
| Conservative | ≈$0,600 trillion | ≈$4,02 trillion |
Protected Central Orientation: $0,6–1,0 trillion per year; NPV ≈$4,0–4,5 trillion
Strict inspection without trade and R&D: $0,779 trillion
The strongest result is a reduction in the risk of irreversible error
NON-MONITIZED USE
Nuclear escalation
Climate and methane
Pandemics
Technoavari
Hotlines, notifications, human solution in the nuclear circuit, rules AI.
Compatible measurements, satellite verification, leakage standards.
Early warning, samples, backup power and vaccine acceleration.
Incident protocols AI, space and cyber systems; recovery time measurement.
The rare risk of × catastrophic damage can not be honestly reduced to one "exact" amount - so it is shown separately.
New START The Expires February 2026; The greatest value is to reduce the likelihood of a false escalation.
Working synchronization should be modular and reversible
ARCHITECTURE
Strategic sustainability
Reproduction
Compatibility
Hotlines, notifications, space, cyberspace, rules AI and incidents.
Climate and methane, pandemics, food, the Arctic, basic science, civil atom.
Metrology, standards, emergency logistics, insurance and calculations of permitted projects.
General data set + independent verification
Phased reversible pilots
Protection of source and project intellectual property
Civil-Military Firewall and Export Control
Diversification of critical supplies
Openness to third countries under the same rules
Project criterion: the result is measurable, dependence is limited, violation is detectable, output is reversible.
Balance begins where forces stop destroying each other.
CONCLUSIONS
Scale achieved; the main limit is reproduction and feedback.
China
Option maximum; limit - long public and infrastructure contract.
USA
Autonomy is strong; the limit is a diversified civil flow.
Russia
$0,6–1,0 trillion/year - central monetary benchmark, not a guarantee.
Synchronization
Less likely nuclear, climate, pandemic and technological disaster.
Main use
Full integration is unrealistic; modular synchronization of measurable public goods is realistic and economically meaningful.
Sources indicated in the presentation 24
- https://data.worldbank.org/?locations=US-CN-RU
- https://www.imf.org/en/blogs/articles/2023/01/16/confronting-fragmentation-where-it-matters-most-trade-debt-and-climate-action
- [/Sources]
- https://www.wto.org/english/news_e/news25_e/dgno_09apr25_e.htm
- https://www.rug.nl/ggdc/historicaldevelopment/maddison/releases/maddison-project-database-2023
- https://www.stats.gov.cn/sj/zxfb/202302/t20230203_1899178.html
- https://www.stats.gov.cn/zt_18555/ztfx/qzxzgcl60zn/202303/t20230301_1920384.html
- https://english.cas.cn/about-cas/
- https://data.worldbank.org/country/china
- https://www.stats.gov.cn/english/PressRelease/202602/t20260228_1962661.html
- https://ourworldindata.org/grapher/annual-co2-emissions-per-country
- https://www.census.gov/programs-surveys/decennial-census/data/tables.html
- https://nces.ed.gov/programs/digest/
- https://www.bea.gov/itable/national-gdp-and-personal-income
- https://www.federalreservehistory.org/
- https://ncses.nsf.gov/pubs/nsbsep20261/discovery-r-d-activity-and-research-publications-2
- https://www.eia.gov/totalenergy/data/monthly/
- https://fiscaldata.treasury.gov/datasets/debt-to-the-penny/debt-to-the-penny
- https://data.worldbank.org/country/russian-federation
- https://www.sipri.org/media/press-release/2026/increasing-focus-nuclear-weapons-amid-heightened-escalation-risks-new-sipri-yearbook-out-now
- https://data.worldbank.org/?locations=1W-US-CN
- https://data.worldbank.org/indicator/NY.GDP.MKTP.PP.CD
- https://www.sipri.org/media/press-release/2026/global-military-spending-rise-continues-european-and-asian-expenditures-surge
- https://www.energyinst.org/statistical-review/resources-and-data-downloads