Brief annotation
About the document
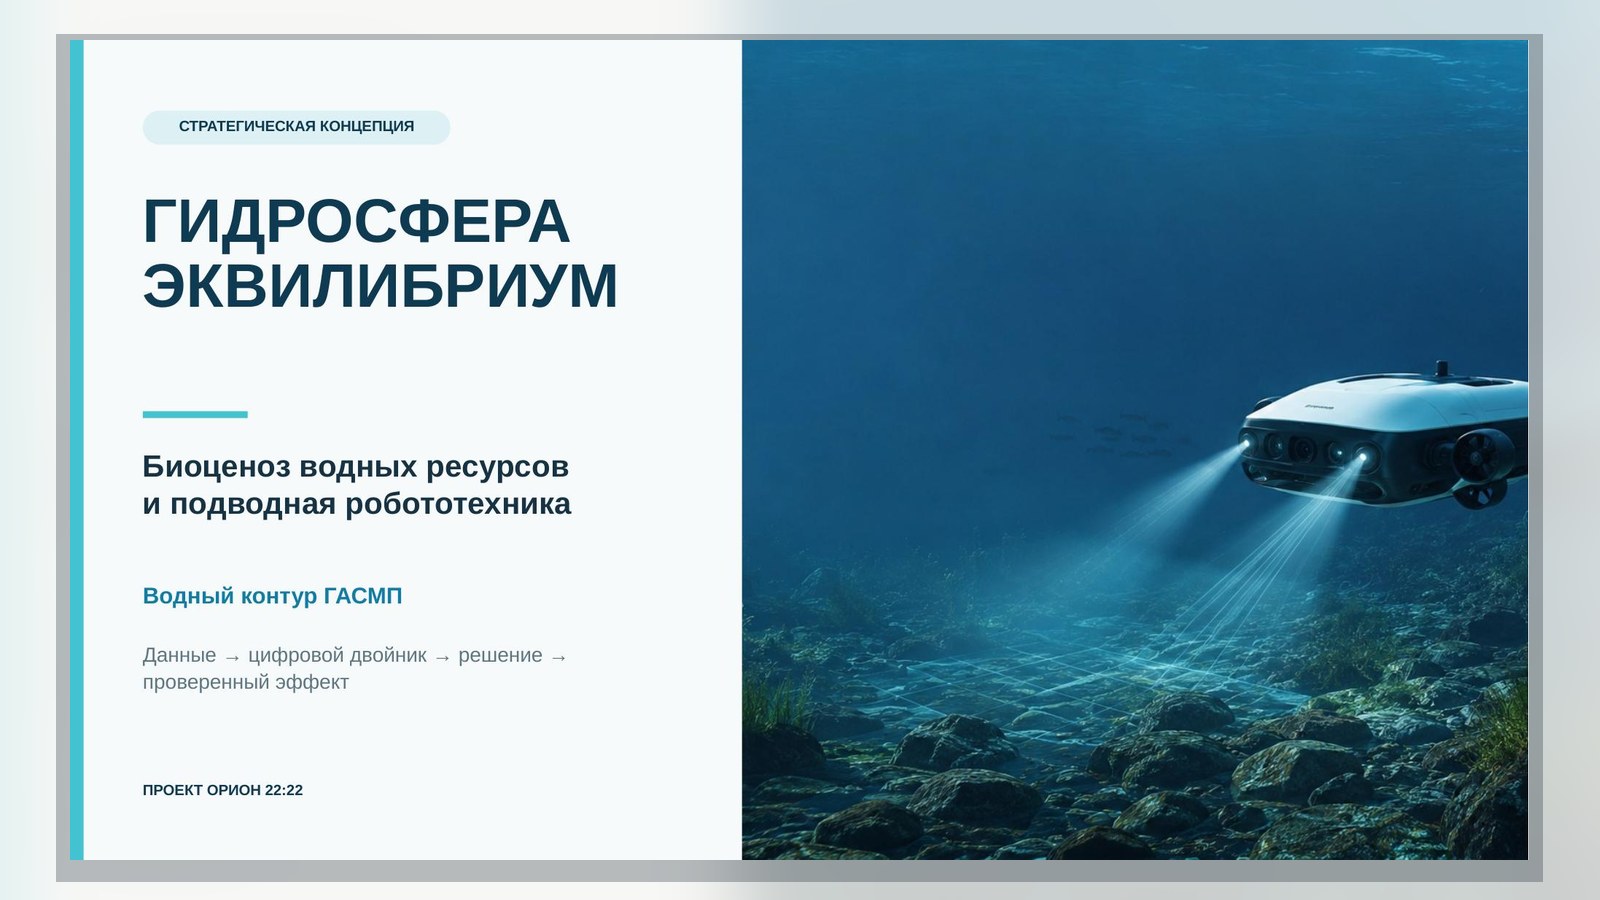
Strategic Concept for the Observation, Conservation and Restoration of Water Systems.
GIDROSFERA_EQUILIBRIUM_Strategicheskaya_prezentatsiya.pptx
Downloading the document...
Global Aerospace Monitoring and Forecasting System
Project ORION22:22
Initiator of the concept: Sokolov Sergey Leonidovich
Version 1.0 | 26 August 2026
Summary of the concept
Key idea. It is necessary to manage not water as a separate resource, but the health of the entire aquatic ecosystem - from watershed and bottom environment to biota, infrastructure and humans. Underwater robotics becomes a mobile sense and action organ, and EQUILIBRIUM turns measurements into a prediction, solution, and verifiable result.
The concept forms a single water contour of GASMP "EQUILIBRIUM" for continuous observation, early warning and restoration management of oceans, seas, rivers, lakes, reservoirs, swamps, groundwater, glaciers and coastal zones. The contour combines aerospace data, hydroposts, laboratories, biocenose monitoring points, autonomous vehicles and a digital twin of a water body.
The basic unit of the result is the hydroecosystem. Its living nucleus is hydrobiocenosis: an interconnected community of microorganisms, plankton, plants, invertebrates, fish and other organisms. The condition is assessed not by one standard of water, but by a system of physical, chemical, biological, functional and restorative indicators.
- EQUILIBRIUM - Data integration, digital twin, causal analysis, prediction and result control.
- GASMP - planetary, basin and inter-territorial observation.
- Underwater robotics - mobile measurements, anomaly confirmation, mapping, inspection, and controlled operations.
- ECO-PPA - Mobilization of resources and payment of measurable, independently confirmed effect.
- SPECZASHCHITA - operator of cooperation, pilot and robotic fleet.
- ESG-IR and EUT - evidence, verification, compatibility of data, equipment and procedures.
The first practical step is proposed 24-month pilot "HYDROSPHERE-1" at the Syzran node of the Volga and adjacent water area of the Saratov reservoir. The parameters of the landfill are specified after the pre-project survey and coordination with the authorized bodies.
Passport document
| Parameter | Contents | Parameter | Contents |
|---|---|---|---|
| Status | Concept, version 1.0 | Supersystem | ORION 22:22 |
| The Digital Core | EQUILIBRIUM | Observation | GASMP |
| Implementation | SPECZASHCHITA | Resource | ECO-PPA |
| Verification | ESG-IR | Compatibility | EUT |
| Horizon | 24 months | Polygon | Syzran / Saratov Reservoir |
Contents
- Strategic basis and system formula
- Terms, object and control boundaries
- Hydrosphere map and typology of water systems
- Threats, deficits and risk scenarios
- Observation architecture and biocenosis point
- Integrated Water Ecosystem Health Index
- Digital Double Hydrosphere
- Underwater robotics: fleet, stations and sensors
- Autonomy, safety and environmental constraints
- Data, communications, registries and evidence
- Management cycle and response
- Institutional architecture of ecosystem
- Pilot "HYDROSPHERE-1"
- Financial and contract model ECO-PPA
- Results and ESG-IR-verification
- Roadmap and Scaling
- Annexes and official sources
The working formula. Hydrosphere -> Hydroecosystem -> Biocenous Point -> Underwater Robotics -> Digital Twin -> warning and action -> ECO-PPA -> ESG-IR-verification.
1. Strategic basis and system formula
Water is both a living environment, a climate regulator, a food and health foundation, a transport infrastructure, an energy resource and a risk carrier. Therefore, separate management of water supply, hydraulic structures, pollution, biodiversity and emergencies inevitably creates information gaps. The hydrosphere requires a system of systems architecture.
V ORION22:22 The new module takes the place of the water circuit of planetary security. He continues the cycle of GASMP: observation -> recognition -> Forecasting -> Warning -> Mobilization -> The response -> Recovery -> control. The difference is that the environmental result is fixed at the level of a specific aquatic biocenosis, and not only at the level of the departmental indicator of water quality.
The main principle. Victory over the water crisis is not the elimination of a single accident, but the achievement of a state in which threats are identified to irreversible damage, resources are mobilized in advance, and recovery is confirmed by measurements of the living system.
1.1. Six functions of the water circuit
- See. To collect a continuous space-time picture of water, bottom, biota, infrastructure and load.
- Understand. Distinguish between natural dynamics, anomaly and dangerous impact; establish the source and causal relationships.
- Predicting. Calculate the spread of pollution, floods, hypoxia, flowering and habitat degradation.
- Agree. Connect authorities, science, businesses, infrastructure operators and society around a single evidence picture.
- Act. Assign inspection and emergency missions, locate the source and carry out permitted recovery activities.
- Check. Compare the state before and after exposure, maintain a digital footprint and independent ESG-IR verification.
1.2. Design principles
- Basin approach: boundaries of analysis are determined by flows of water, matter and energy, not just administrative territories;
- biocentricity: the state of living communities is considered as a final indicator of environmental quality;
- Multi-level: satellite, drone, buoy, bottom station, robot and laboratory complement, not replace each other;
- Evidence: each measurement has a coordinate, time, calibration, uncertainty, quality sign, and processing history;
- Prevention before response: priority is given to early detection and preventable damage.
- person in the loop of the solution: autonomy of navigation does not mean autonomy of dangerous impact;
- Open compatibility: EUT protocols provide connection of new sensors, devices and participants without breaking the system;
- Measurable result: resource ECO-PPA is associated with verifiable environmental, economic and social effects.
2. Terms, object and control boundaries
The name “Water Biocenosis” is retained as a program formula. In the scientific and normative part, four levels must be distinguished. This eliminates the mixing of water as a resource, a living community and the ecosystem as a whole.
| Term | Working definition | Role in the system |
|---|---|---|
| Hydrosphere | The Earth's water shell: oceans, seas, surface and groundwater, ice, snow, and atmospheric moisture. | Planetary object of observation |
| Water object | Spatially defined accumulation of water with stable boundaries and regime. | Unit of certification and rights |
| Hydrobiocenosis | Community of aquatic organisms and their system of connections. | Live status indicator |
| Hydroecosystem | Water object, biotope, biocenosis, flows of matter and energy, external influences. | The basic unit of result management |
| Swimming pool | Territory of formation of runoff and transfer of substances to a water object. | Boundary of causal analysis |
2.1. Composition of the managed system
- Water: level, volume, current, temperature, salinity, transparency, chemical composition and water exchange.
- Bottom environment: relief, precipitation, pollution, gas extraction, habitats and underwater infrastructure.
- Biota: Microorganisms, phytoplankton, zooplankton, macrophytes, benthos, fish, birds and aquatic mammals.
- Coastal belt: floodplains, wetlands, spawning grounds, protective vegetation and recreation areas.
- Man and the economy: water intake, discharges, agriculture, shipping, mining, energy, tourism and communal infrastructure.
- Management: legal regimes, data owners, responsible operators, laboratories, emergency services and public control.
Unit of result. A specific hydro-ecosystem with boundaries, baseline, health index, sources of load, infrastructure, process owners and a verifiable history of change is passported.
3. Hydrosphere map and typology of water systems
The architecture should work for different water modes, but not impose the same model on them. For each type, their own regulatory ranges, observation frequency, set of bioindicators and the configuration of a robotic cell are specified.
| Type | Key processes | Monitoring priority |
|---|---|---|
| Oceans and seas | currents, heat exchange, acidification, deoxygenation, shelf processes | profiles, gliders, buoys, acoustics, biodiversity |
| Rivers | runoff, pollution transfer, floods, channel dynamics | hydraulic posts, route AUV/USV, sources of discharge |
| Lakes and reservoirs | stratification, flowering, hypoxia, accumulation in precipitation | vertical profiles, bottom stations, eDNA |
| Swamp and floodplains | water retention, carbon, filtration and spawning | hydroperiod, vegetation, connection with bed |
| Groundwater | food, level, migration of pollution | wells, hydrochemistry, flow models |
| Glaciers and snow | accumulation, melting, contribution to runoff | satellite, ground stations, balance models |
| Estuaries and deltas | mixing of water, sediments, salt wedge | multi-layer profiles, bottom, habitats |
| Artificial systems | water intake, cleaning, canals, cooling | Infrastructure, efficiency, emergency risks |
3.1. Scope of observation
- Planetary. Water balance, temperature, ice, major pollution and climate trends.
- Pool. Flow, floods, droughts, transfer of matter between territories and water bodies.
- Aquatorial. Status of a specific water body, bottom environment, habitats and infrastructure.
- Local. Load source, emergency site, spawning ground, water intake, dam, pipeline or port.
- Micro level. Sample, biofilm, microorganisms, pollutant, individual object or defect.
4. Threats, deficits and risk scenarios
GASMP considers the threat as a dynamic event, rather than a static exceedance mark. For each event, the probability, scale, exposure, speed of development, reversibility and readiness to respond are recorded.
- Hydrological threats: floods, droughts, shallowing, change of channel, storm surges, ice phenomena and destruction of coasts.
- Hydrochemical threats: petroleum products, heavy metals, biogenic elements, pharmaceutical residues, microplastics and oxygen deficiency.
- Biological threats: toxic flowering, pathogens, invasive species, extinction of key species, and breaking of food chains.
- Man-made threats: accidents of dams, pipelines, platforms, ships, sewage treatment plants and submarine cables.
- Resource threats: overuse of water, depletion of underground horizons, illegal fishing and user conflict.
- Information threats: observational omissions, incompatible formats, unconfirmed data, transmission delay, and cyber exposure.
4.1. Priority model
For operational ranking, a dimensionless risk indicator is used:
R = P x S x E x (1 - G)
where P is the probability of the event; S - severity of consequences; E. Exposure to people, ecosystems and infrastructure G - the readiness of the system to detect and respond. The coefficients are normalized in the range from 0 to 1. The formula serves as a framework, and thresholds are approved for each pool after the baseline.
Confirmation rule. One anomalous indication is not recognized as an incident. Independent confirmation by another sensor, apparatus, satellite signature or test sample is required. For toxins, pathogens, heavy metals and microplastics, robotic screening is confirmed by an accredited laboratory.
5. Observation architecture and biocenosis point
The system is built as a network of complementary levels. The space circuit sees the area and dynamics, the stationary nodes give continuous series, the robots reveal depth and localize the source, the laboratory provides metrological confirmation, and the digital twin links the facts into a causal model.
Figure 1. Multilevel architecture of observation, analysis and action
5.1. Hydrobiocenose monitoring point
Hydrobiocenose monitoring point (HBTM) is a digital sense organ of the aquatic area. This is not a single sensor, but a certified cell that includes a location, stationary sensors, robot routes, a sampling program, bioindicators, communication channels, and response scenarios.
Five compulsory point questions
- What is happening to the water, bottom, biota and infrastructure now?
- Is the change natural, acceptable, or dangerous?
- Where is the likely source and what are the causal relationships?
- How does change affect hydrobiocenosis, humans, and farming?
- What actions are necessary, who is responsible and how will the result be checked?
5.2. Composition of the base point
- bottom or shore multisensor node with reference time and coordinates;
- Buy-gate or coastal data channel;
- Control program of sampling and laboratory reconciliation;
- route AUV/USV for spatial expansion of measurements;
- biological profile: eDNA, plankton, benthos, fish, macrophytes and acoustic landscape;
- thresholds, quality rules, responsible persons and event logs;
- baseline, status index and post-impact verification scenarios.
6. Integrated Water Ecosystem Health Index
A single index is needed to compare the state in time and prioritize actions, but should not hide the reasons. Therefore, the final assessment is always disclosed by domain, and the risk and anthropogenic load are shown by individual layers.
| Domain | Contents | Examples of indicators |
|---|---|---|
| H - Hydrology | Sustainability of the water regime | level, flow rate, water exchange, temperature, ice mode |
| C - hydrochemistry | quality and suitability of the environment | O2, pH, mineralization, N/P, organics, pollutants |
| B - Biota | Integrity of the Living Community | species richness, key species, plankton, benthos, fish |
| F - Functions | Work of ecosystem | self-purification, productivity, trophic bonds, carbon |
| K - Connectivity | Continuity of habitats | migration routes, spawning grounds, coastal connectivity |
| V - Resilience | Ability to return to normal | Recovery speed, environmental reserve |
The index is calculated in the range from 0 to 100:
I_GE = Σ wᵢ x Sᵢ, Σ wᵢ = 1
Sᵢ is the normalized domain score, wᵢ is the weight set for the type of water system and management purposes. Universal weights are not assigned in advance: they are calibrated by the scientific and methodological council for reference sites and 90-day baseline, then undergo independent verification.
6.1. Additional indexes
- Risk index R. Probability and expected damage from confirmed threats.
- Load index L. Intensity of water intake, discharges, shipping, extraction and conversion of coasts.
- Data index D. Completeness, timeliness, calibration, uncertainty and traceability of measurements.
- Readiness index G. Ability to detect, confirm, localize and eliminate an event at regulatory time.
- The index of recovery effect E. Measurable improvement with respect to the baseline, taking into account natural variability.
Prohibition of simplification. The index does not replace primary data, expert interpretation and legal regulations. Any resulting number shall be disclosed prior to measurement, method, instrument, calibration, sample and responsible owner.
7. Digital Double Hydrosphere
Digital twin is a dynamic space-time model of a water body that combines pool geometry, hydrodynamics, chemical processes, biota, infrastructure, and control scenarios. This is not a visual map, but a computational decision-making mechanism.
7.1. Four interrelated models
- Hydrodynamic. Level, flow, currents, stratification, heat transfer, sediments and pollutants.
- Hydrochemical. Oxygen, biogenic elements, organics, toxicants, reactions and exchange with bottom sediments.
- Environmentally. Habitats, populations, food links, productivity, invasive species, and resilience.
- Infrastructure-Risk. Water intakes, discharges, dams, pipelines, ports, cables, emergency zones and responsible operators.
7.2. Four modes of operation
- "What's going on?" Current state and deviation from the seasonal baseline.
- "Why does it happen?" Sources, inverse transport simulations, and causal relationships.
- "What will happen?" Scenarios of spread and damage under different weather, hydrological and economic conditions.
- "What to do?" Verification mission, localization, permissible measures, resource request and result control plan.
7.3. Data trust contour
Each fact comes along with a coordinate, time, device ID, firmware and mission version, measurement method, calibration, uncertainty, quality sign, and transformation chain. The original data remain unchanged; the derived layers and projections have a model version and explanation.
The result of a digital double. Not a "card for the sake of the card", but the assigned action: who to check with what device, in what zone, at what time, according to what protocol and by what measurement to confirm the recovery.
8. Underwater robotics: fleet, stations and sensors
Underwater robotics forms a mobile sensory-executive system of water biocenosis. The devices work together with stationary stations, laboratories and surface locks. Their task is to expand the coverage, quickly confirm events and safely perform operations that are inaccessible or dangerous to humans.
Figure 2. Basic robotic water circuit cell
8.1. Apparatus classes
| Class | Main objective | Mode |
|---|---|---|
| Underwater glider | long-term profiles of temperature, salinity, oxygen, currents and chlorophyll | days / weeks |
| AUV-scrutin | bathymetry, bottom mapping, search for contaminants and objects | Route |
| Hovering-AUV | precise operation of dams, pipes, reefs and bottom stations | Maneuverable |
| ROV | video diagnostics, sampling, operator-controlled manipulation | Cable |
| HROV / worker ROV | repair, valves, sensors, garbage and nets rise | Operators |
| The Bottom Robot | Precipitation, cables, pipes, habitats and long inspection | Slippery |
| Profiler / Drifter | vertical structure and transport of water masses | Drifting |
| USV | navigation, communications, energy, mapping and submarine support | surface water |
8.2. Stationary nodes
- benthic measuring station for bottom, precipitation, bottom water and acoustic background;
- profiling buoy with automatic movement of sensors vertically;
- underwater observatory for significant and sensitive areas;
- docking station for docking, diagnostics, charging and unloading data;
- navigation and communication node LBL/USBL and acoustic repeater;
- Calibration station to check the drift of sensors;
- a buoy-gate that converts an underwater channel into satellite, cellular or radio communications;
- Coastal situational post, mission manager and digital twin.
9. Sensory Complex and Missions
The payload is formed modularly for the type of water system and task. For each instrument, the accuracy, range, frequency, calibration, drift and usability of the data for the management solution are specified.
| Group | Funds | Which confirms |
|---|---|---|
| Physics of Water | CTD, level, turbidity, ADCP, turbulence | water structure, currents, transport |
| Hydrochemistry | O2, pH, ORP, pCO2, N/P, organic, hydrocarbons, methane | Quality of environment and anomalies |
| Biology | chlorophyll-a, phycocyanin, eDNA, microscopy, hydrophones | flowering, species, biomass, acoustics |
| Bottom | multibeam and lateral sonar, profiler, cameras, laser | relief, precipitation, habitat |
| Infrastructure | thickness, corrosion, vibration, deformation, leaks | technical condition and risk |
| Navigation | INS, DVL, SLAM, LBL/USBL, GNSS after rising | coordinates, route, security |
9.1. Typical set of missions
- creation of bathymetric and biotope map;
- building a four-dimensional picture of the water column;
- search for hypoxia, eutrophication and harmful flowering;
- localization of oil, chemical and municipal discharges;
- control of migrations, spawning grounds, biomass and invasive species;
- inspection of dams, water intakes, pipes, cables and port facilities;
- detection of lost networks, garbage and dangerous objects;
- control of the state before and after environmental measures.
9.2. Digital passport of the device
Each robot and stationary node has a passport: working depth, autonomy, payload, navigation accuracy, acoustic profile, energy reserve, acceptable conditions, calibration history, maintenance, software version, and a safe failure scenario.
10. Autonomy, safety and environmental constraints
Architecture divides autonomy of movement, autonomy of observation and the right to influence. The robot can independently rebuild the route within the approved mission, but does not receive the right to a dangerous material impact without the decision of an authorized person.
| Level | Features | Tolerance |
|---|---|---|
| A0 | manual control | Operator performs all actions |
| A1 | course, depth and position retention | Assisted Mode |
| A2 | following an approved route and collecting data | automatic route |
| A3 | Mission and obstacle avoidance | Independent observation |
| A4 | Rebuilding the route on an anomaly in the geozone | I1 |
| A5 | Cooperation of the group of devices | Only approved observation tasks |
10.1. Impact classes
- I0 - contactless. Filming, acoustic observation, mapping and measurement.
- I1 - small reversible. Regulated sampling, timestamp, sensor installation. Allowed in an approved mission.
- I2 - local technical. Valve overlap, installation of a barrier or sorbent, repair, garbage recovery. Only after confirmation by the operator.
- I3 - ecosystem. Chemical treatment, dredging, incorporation or removal of organisms, change of hydrological regime. Autonomous robots are prohibited; a separate project, environmental assessment and permit are required.
10.2. Three independent circuits
- Mission outline - the route, measurements, processing and execution of the task.
- Safety contour - depth, collisions, geo-fence, energy, leakage, communication and environmental constraints.
- Rescue circuit - stop, return, ascent, ballast reset, beacon and search.
10.3. Mandatory restrictions
- Signed firmware and missions, unique machine identity, log commands and changes;
- double confirmation of dangerous operations and stopping manipulators in case of loss of communication;
- geo-zones, limits of depth, time, speed and energy reserve for return;
- quiet mode near spawning grounds and marine mammals, the limit of active acoustic power;
- cleaning and disinfection of devices between water bodies to exclude the transfer of pathogens and invasive species;
- The lack of fully autonomous use of chemical and biological means.
11. Data, communications, registries and evidence
The underwater environment limits the range and speed of communication, so the network is built multi-level. The acoustic channel transmits commands and key telemetry, the optical channel is used at short distances and at the docking station, and the full array of data is stored on board and uploaded on a store-and-forward basis.
11.1. Channels
- acoustic communication - a distant underwater channel of commands and telemetry;
- optical communication - high-speed transmission at a short distance;
- Induction communication - docking and local exchange;
- fiber optic cable - ROV and stationary observatories;
- satellite, cellular and radio communication - via buoy or USV;
- Package priority: Accident -> Device condition -> Warning -> Scientific data.
11.2. Thirteen basic registers
Register architecture links observation, decision, resource, and result. Each object has a permanent ID and version history.
| № | Register | Key essence |
|---|---|---|
| 1 | Water objects | borders, regime, status and owners |
| 2 | Watersheds and streams | runoff, inflows, transport and communications |
| 3 | Habitats | Bottom, coastal and spawning zones |
| 4 | Types and communities | bioindicators, eDNA, numbers and migrations |
| 5 | Load sources | water intakes, discharges, agriculture, shipping |
| 6 | Infrastructure | dams, pipes, cables, ports and water intakes |
| 7 | Sensors and stations | passport, calibration, accuracy and condition |
| 8 | Robotic fleet | apparatus, payload, autonomy and tolerances |
| 9 | Missions | route, task, teams, log and result |
| 10 | Samples and laboratories | chain of storage, methods and conclusions |
| 11 | Events and incidents | anomaly, confirmation, source and risk |
| 12 | Measures and recovery | decision, executor, resources, state before/after |
| 13 | Effects and Verification | KPI, evidence, audit ESG-IR and report version |
11.3. Quality and compatibility
The EUT establishes uniform measurement passports, minimum metadata, unit directories, coordinate systems, time rules, versioning, exchange interfaces, uncertainty marking, and calibration procedures. For marine sensors and underwater photography are taken into account ISO 22013:2021 and ISO 23731:2021; for AUV and mapping - ISO 20682:2026 and ISO 25451:2026 [6-9].
12. Management cycle and response
The event model eliminates the situation when the signal remains a report without the owner. Each confirmed event is assigned a class, a coordinate, a risk level, a deadline, a responsible and a set of evidence.
- Surveillance. A fixed network, satellite or robot detects a deviation from the baseline.
- Automatic inspection. The system evaluates the quality of the data, the context of the season, the state of the sensor and possible false reasons.
- Confirmation mission. Another sensor, robot, route or control sample is assigned.
- Localization. The digital twin combines currents, load sources, and time sequence.
- Classification of risk. The scale, exposure, reversibility and urgency are determined.
- Decision. The authorized manager selects the acceptable scenario and assigns resources.
- Action SPECZASHCHITA or a profile operator performs a technical, organizational or recovery activity.
- Control mission. The independent route and the test compare the state before and after.
- Verification. ESG-IR confirms achievement KPI and closes the event or returns it for revision.
12.1. GASMP Event Classes
| Class | Example | First Action |
|---|---|---|
| Hydrological | flood, shallowing, change of current | model and exposure areas |
| Hydrochemical | hypoxia, oil stain, toxicant | Additional profile and test |
| Biological | flowering, death of fish, invasive species | Biomission and laboratory confirmation |
| Technogenic | Leakage, pipe defect, dam risk | ROV-Inspection and notification of the owner |
principle of independence. The control mission is performed by another apparatus or another measuring channel. Verifier ESG-IR is not organizationally subordinate to the operator receiving payment for the result.
13. Institutional architecture of ecosystem
The water circuit does not create a new department instead of the existing powers. It forms a suprasystemic mechanism for harmonizing data, forecasts, resources, actions and evidence, while maintaining the legal responsibility of authorized bodies and infrastructure owners.
| Contour | Function | Product |
|---|---|---|
| ORION 22:22 | Supersystem navigation and semantic integrity | a single map of goals and functions |
| EQUILIBRIUM | integration, digital twin, modeling and forecasting | status map, scenario and result control |
| GASMP | satellite, aerospace and inter-territorial surveillance | Early Warning |
| SPECZASHCHITA | pilot and cooperation operator, robotic fleet | Mission, performance and operation |
| ECO-PPA | Resource mobilization and contract result | Financial model and payments |
| ESG-IR | indicators, evidence and independent verification | Verified Report |
| EUT | unified protocols, data and compatibility | standards and passports |
| SFERA | Communication, participation and scaling | portal, partnerships and public layer |
| Heritage archive | History, origin and preservation of baselines | Long-term evidence loop |
13.1. Management bodies
- Interdepartmental Council - priorities, access to data, regulatory support and scaling solution.
- Project office SPECZASHCHITA - schedule, procurement, cooperation, missions, safety and operation.
- Scientific and methodological advice - baseline, bioindicators, models, thresholds and interpretation.
- Technological consortium - robotics, sensors, communications, energy, service and localization of production.
- Independent verifier - data verification, KPI, calculation of the effect and compliance with procedures.
- Authorized bodies - legal decisions, supervision, warning of the population and measures of coercion.
14. Pilot "HYDROSPHERE-1"
Proposed landfill. Syzran node of the Volga and the adjacent water area of the Saratov reservoir. The preliminary scale is 50-100 km of water system. The final boundaries are determined after the survey and approval.
The range is connected to the already formed contour SPECZASHCHITA and should include the main course, small tributaries, coastal zone, industrial and communal load points, natural reference area, hydraulic structures and available underwater infrastructure facilities.
14.1. Basic Robotic Cell
- network of bottom and coastal sensor nodes;
- Buy-gate with energy module;
- docking station;
- long-term patrol equipment;
- maneuverable AUV;
- observation ROV;
- worker ROV on demand;
- mobile sampling complex;
- Coastal Situation Post and Digital Double.
14.2. Stages
| Stage | Timeframe | Main result | Checkpoint |
|---|---|---|---|
| 1. Passports | 0-3 months | boundary, baseline, load map and measurement program | the Test Site Passport |
| 2. Deployment | 4-6 months | post, robots, buoys, communication and integration | complex ready to work |
| 3. Monitoring | 7-12 months | map of the bottom and habitats, laboratory reconciliation, training models | Confirmed data quality |
| 4. Prognosis and response | 13-18 months | early warning, source search, monitoring activities | scripts worked out |
| 5. Verification | 19-24 months | audit ESG-IR, economy, EUT package and standard solution | decision on scaling |
14.3. Products of the pilot
- digital passport and double water area;
- map of the bottom, habitats, sources of risk and underwater infrastructure;
- robotic fleet, docking station and situational post;
- Early warning system and log of confirmed events;
- proven methodology of the water ecosystem health index;
- Verified ESG-IR reporting;
- EUT standards package and operation economy;
- standard set of replication for river, lake, marine and Arctic territories.
15. Financial and contract model ECO-PPA
ECO-PPA links the long-term readiness of the infrastructure with the payment of the confirmed result. The model does not transfer uncontrolled natural risks to the operator, but makes it responsible for the performance of the system, the implementation of the observation program, the quality of data and the speed of response.
15.1. Preliminary funding structure of the pilot
| Source | Share | Purpose |
|---|---|---|
| State / Regional Order | 25% | basic infrastructure and open environmental layer |
| Anchored consumers | 25% | water utilities, industry, energy, ports, GTS |
| Leasing and manufacturers | 25% | robotics, stations, service and localization |
| Reserve ECO-PPA | 15% | payment of independently confirmed results |
| Scientific and environmental programmes | 10% | methods, research and innovation |
Interest is a project model and is specified after a technical survey, the calculation of capital and operating costs and the identification of participants.
15.2. Structure of payment to the operator
- 60% - readiness and scope of services: infrastructure, accessibility, missions and observation program.
- 25% - quality and SLA: completeness of data, calibration, confirmation and response time.
- 15% - confirmed effect: prevented damage, reduction of abnormal conditions or restoration of the selected indicator.
15.3. Operational economy
After the pilot, the revenue model is formed from a subscription to monitoring, robotic inspections, emergency survey, service contracts, preparation of evidentiary ESG-IR reporting, maintenance of underwater infrastructure and the provision of verified data for science and management in an acceptable legal regime.
16. Results and ESG-IR-verification
Indicators are divided into system availability, data quality, operational efficiency, safety, environmental condition and economic effect. Environmental goals are set after the baseline so as not to replace the result with a predetermined number.
| Block | Offered KPI | Verification |
|---|---|---|
| Availability | at least 95% monitoring availability | Journal of nodes and channels |
| Coverage | 100% approved pilot water area mapped | Mission + Geodata |
| Security | at least 90% non-violation missions; no secondary harm | log of missions and incidents |
| Quality | Key measurements confirmed by field and laboratory methods | Calibration and Sample Chain |
| Decision | dispatch solution for confirmed threat up to 30 minutes | Event timestamps |
| Survey | start of the target mission up to 6 hours | launch plan and log |
| Source | Localization of the probable source in at least 80% confirmed cases | Model + Control Sample |
| Efficiency | the period of underwater survey is reduced by at least 40% | Comparison with the basic process |
| Cost | unit cost of the surveyed water area is reduced by at least 25% | financial model |
| Financing | not less than 50% extrabudgetary funds | contracts and payments |
| Evidence | 100% key KPI have a digital footprint | Audit ESG-IR |
16.1. Environmental KPI after base line
- reduction of the duration and area of hypoxia or other target anomalies;
- reduction of load at selected control points;
- restoration of connectivity or status of priority habitat;
- change of the integral index and its domains;
- Increased preparedness for prevention and reduction of expected damage;
- lack of transfer of contaminants, pathogens or invasive species by robotic means.
Criteria for closing an event. The event is considered completed not after the completion of work, but after independent confirmation of the required state in the established time window.
17. Roadmap and Scaling
17.1. Horizon 0-24 months
- Establish a project office, a scientific and methodological council and an independent verification outline.
- Identify the landfill, data owners, legal regimes and reference sites.
- Approve the terms of reference for a digital double, GBTM and a robotic cell.
- To form a technological consortium and a register of domestic and compatible solutions.
- Expand communication, stations, robotic fleet and laboratory circuit.
- Conduct a 90-day baseline, followed by an annual cycle of seasonal observations.
- To work out at least three scenarios: pollution, biological anomaly and man-made defect.
- Conduct ESG-IR audit, economic calculation and scaling decision.
17.2. Horizon 3-5 years
- creation of a network of typical river, lake, coastal and Arctic polygons;
- serial production of modular vehicles, stations and docks;
- National register of aquatic biocenoses and underwater infrastructure;
- integration with aerospace, climate and extreme contours of GASMP;
- export of a model solution through international cooperation and SFERA;
- formation of a market of verified services for the prevention of water damage.
17.3. Conditions of replication
It is not a single robot that is scaled, but an integral cell: the object’s passport, base line, sensors, fleet, communications, digital twin, decision rules, financial contract and independent verification. The configuration changes by water type, but the digital and management architecture remains the same.
18. Expected results
18.1. For the State
- a single reliable picture of water risks and the state of biocenoses;
- Early warning and reduction of preventable damage;
- Interagency compatibility and responsibilities;
- a tool for prioritizing investments, monitoring programs and assessing the impact;
- Technological Sovereignty in Underwater Robotics and Sensory.
18.2. For regions and municipalities
- passport of the water area and a clear map of the sources of load;
- objective data for water supply, cleaning, floods and recreation;
- rapid diagnosis of hard-to-reach areas and underwater structures;
- attraction of extra-budgetary funds through ECO-PPA.
18.3. For science and industry
- long-term verified data series and full-scale polygons;
- order for sensors, devices, communications, energy, materials and software;
- comparable eDNA, hydroacoustics, imaging and robotic sampling techniques;
- accelerated testing of new technologies in a controlled legal regime.
18.4. For man and nature
- clean and accessible water;
- conservation of habitats, fish resources and biodiversity;
- Less risk of accidents, pollution and hidden accumulation of damage;
- transparent evidentiary information about the state of the territory;
- transition from the elimination of consequences to the restoration of the viability of water systems.
Strategic outcome. It is not a water monitoring system that is being created, but an infrastructure for preserving and restoring a living hydrosphere, in which data, robotics, management and financing form a single closed cycle.
Annex A. Hydroecosystem passport
| Passport section | Mandatory content |
|---|---|
| Identification | code, name, type, coordinates, boundaries, swimming pool, legal status |
| Hydrology | level, flow rate, water exchange, currents, temperature, ice, seasonality |
| Hydrochemistry | basic and special indicators, background, thresholds, uncertainty |
| Biocenosis | habitats, species, indicators, eDNA, trophic bonds |
| Bottom and shore | relief, precipitation, erosion, pollution and sensitive areas |
| Load | Water intakes, discharges, agriculture, transport and population |
| Infrastructure | GTS, pipes, cables, ports, water intakes, treatment |
| Observation | GBTM, stations, routes, sensors, laboratories and communications |
| Risks | scenarios, exposure, responsible, timing and resources |
| Indicators | reference line, I_GE, R, L, D, G and environmental KPI |
| History | events, measures, model versions, control and ESG-IR-audit |
Annex B. Robotic mission card
- Mission ID, date, customer and authorized manager;
- purpose, hypothesis, area, geo-fence, depth and time window;
- device, payload, firmware versions and tasks;
- route, energy budget, reserve and communication loss scenario;
- autonomy class A0-A5 and permissible exposure class I0-I3;
- sensors, calibration, frequency and quality criteria;
- rules for detection, confirmation and reassignment of the route;
- Biota protection measures, acoustic limitations and disinfection;
- a chain of data, samples and laboratory results;
- Summary, deviations, incidents, control mission and closure decision.
Annex B. Minimum base line program
- Inventory of water body, catchment, sources of load and infrastructure.
- Seasonal and daily profiles of physical and hydrochemical parameters.
- Bathymetry, bottom sediments and a map of key habitats.
- Bioindication: plankton, benthos, fish, macrophytes, eDNA and acoustic background.
- Control and reference areas, laboratory reconciliation and uncertainty assessment.
- Verification of communication, autonomy, return of devices and failure scenarios.
- Assessment of natural variability and setting thresholds for events.
- Calculation of initial I_GE, R, L, D and G, environmental approval KPI.
Official sources and methodological framework
Relevance of links and statuses checked for 26 August 2026. Sources are used as a methodological basis; specific mandatory requirements are determined by applicable legislation, water area conditions and approved technical specifications.
- [1] WMO. State of Global Water Resources 2024 (2025). Official page
- [2] UN-Water. Progress on Water-related Ecosystems - 2024 Update. Official page
- [3] IOC/UNESCO. State of the Ocean Report 2024. Official page
- [4] GOOS / IOC-UNESCO. Global Ocean Observing System: 2030 Strategy. Official page
- [5] IOC-UNESCO OBIS. OBIS 2030: The Biodiversity Data Hub for the Ocean Decade Actions. Official page
- [6] ISO 22013:2021. Marine environment sensor performance - General requirements. Official page
- [7] ISO 23731:2021. In situ image-based surveys in deep seafloor environments. Official page
- [8] ISO 20682:2026. Autonomous underwater vehicles - Risk and reliability. Official page
- [9] ISO 25451:2026. Seafloor mapping with uncrewed marine vehicles. Official page
- [10] IMO. MEPC.1/Circ.906/Rev.1. Underwater noise from shipping (2025). Official page
- [11] GOOS. Essential Ocean Variables. Official page
- [12] NOAA IOOS. QARTOD - Quality Assurance of Real-Time Oceanographic Data. Official page
- [13] NOAA Ocean Exploration. Autonomous Underwater Vehicles. Official page
Conclusion
HYDROSPHERE EQUILIBRIUM connects what exists today separately: water observation, assessment of living communities, underwater infrastructure survey, robotic missions, digital forecasting, resource mobilization and proof of outcome.
The system shifts control from episodic sampling and response to continuous understanding, early warning and controlled recovery. Its basic product is a healthy, monitored and protected hydroecosystem with a digital passport, a responsible process owner and a verifiable history of change.
The next organizational step - pre-project survey of the landfill "HYDROSPHERE-1", approval of the scientific program of the basic line and the formation of a technological consortium SPECZASHCHITA.
Source materials
Originals and versions of the document
- GIDROSFERA_EQUILIBRIUM_Strategicheskaya_kontseptsiya.docxDOCX · main document
- GIDROSFERA_EQUILIBRIUM_Strategicheskaya_prezentatsiya.pptxPPTX · related version
Other editions in web format
Each version is disclosed separately; the sequence of the source document is saved.
HYDROSPHERE EQUILIBRIUMGIDROSFERA_EQUILIBRIUM_Strategicheskaya_prezentatsiya.pptx · Web Text+
Biocenosis of water resources and underwater robotics
Water contour GASMP
Data → digital twin → solution → proven effect
PROJECT ORION22:22
Water - a strategic contour of security and development
STRATEGIC FRAMEWORK
One resource simultaneously determines the viability of ecosystems, territories and economies.
Cities
and industry
Environmental
Sustainability
Water intake • production
biodiversity • climate
WATER
Food
and energy
infrastructure
Life
agricultural sector • hydropower
Health
Population
Warning
Damage
drinking water • sanitation
Floods • Accidents • drought
ORION22:22 / EQUILIBRIUM
Data is separate from decisions
THE PROBLEM
Measurements accumulate, but the source of the threat is localized late, and the effect of actions is often not proven.
DATA FRAGMENTS
IMPLICATIONS
Threat detected after fact
laboratory tests
reaction after damage accumulation
buoys and hydroposts
There is no single causal model
DIVISIONS
Satellite observations
data does not add up to the route of action
Infrastructure Inspections
Result not verified
Unable to link payment to effect
Incident reports
Need a closed circuit: fact → solution → action → check
ORION22:22 / EQUILIBRIUM
EQUILIBRIUM locks control in a single cycle
SYSTEM FORMULA
Watch
Verify
Recognise
DIGITAL DOUBLE
+ Rules of decision
+ independent verification
Return
to the norm
Forecast
Action
Notify
Resources
ORION22:22 / EQUILIBRIUM
HYDROSPHERE - water module EQUILIBRIUM and GASMP
ARCHITECTURE
Monitoring becomes management after the action is assigned and the result is verified
ORION22:22 / EQUILIBRIUM
Hydroecosystem - more than water sample
OBJECT OF MANAGEMENT
The result unit receives boundaries, baseline, health index, process owners, and history of change.
Water
Bottom Wednesday
Biota
Level • Current • Temperature • Chemistry
relief • precipitation • gassing • objects
plankton • benthos • fish • eDNA
Coastal Belt
Man and economy
Management
floodplains • spawning grounds • vegetation
water intake • dumping • shipping
Modes • Owners • Laboratory • Service
The final metric is the viability of the water system, not a separate sensor reading.
ORION22:22 / EQUILIBRIUM
Five levels give a continuous picture - from the pool to the sample
OBSERVATION
01 PLANETARY
water balance • temperature • ice • large pollution
02 POOL
Runoff • floods • drought • transfer between territories
03 AQUATORIAL
water body • bottom • habitat • infrastructure
04 LOCAL
loading source • water intake • dam • pipeline
05 MICRO-LEVEL
sample • biofilm • microorganism • defect
ORION22:22 / EQUILIBRIUM
Health index reveals cause, not hides it
MEASUREMENT
Hydrology
Hydrochemistry
0–100
Water Mode
Quality of environment
IGE = Σ wᵢ × Sᵢ
Biota
Functions
Scales are calibrated on reference plots and a 90-day base line.
Living Community
Work of ecosystem
Connectivity
Resiliency
R Risk L Load
D Data quality
G Readiness E Effect
Continuity of habitats
return to normal
ORION22:22 / EQUILIBRIUM
Mobile sense organ - and controlled action
UNDERWORK ROBOTOTECHNIKA
AUV
mapping and search
ROV
Inspection and sampling
USV
communication, energy, support
Glider
Long-term profiles
Fleet + stations + laboratories + digital twin
ORION22:22 / EQUILIBRIUM
Autonomy of movement ≠ The autonomy of a dangerous decision
SAFETY
AUTONOMOUS LEVELS A0-A5
CLASS OF IMPACT
A0
Manual
A1
Course / Depth
A2
route
A3
Mission
A4
new
route
A5
Group
surveillance
Reversible Selection
Automation increases coverage, but does not extend legal exposure tolerance.
Local Operation
THREE INDEPENDENT CONTOURS
ecosystem intervention
Mission
Security
Salvation
route • measurement • processing
Geofence • energy • collision
Stop • Return • Ascent
I2 - only after confirmation by the operator
I3 - Autonomous robots banned
ORION22:22 / EQUILIBRIUM
Measurements are converted into assigned action
DIGITAL DOUBLE
Not a map for the sake of a map, but an explainable model: what is happening, why, what will happen next and what to do.
Hydrodynamics
Hydrochemistry
level • current • carry
Oxygen • Biogens • Toxicants
DIGITAL
DOUBLE
Ecology
Infrastructure and risk
Habitats • Population • Functions
Dam • Pipes • Ports • Accidents
Who to check → where → when → by which device → according to which protocol → how to confirm recovery
ORION22:22 / EQUILIBRIUM
The system detects four classes of events in advance
Early warning
Priority is determined by the dynamics of risk, and not only by the fact of exceeding an individual indicator.
HYDROLOGY
HYDROCHEMICALS
BIOLOGY
TECHNOGENIC
Flooding
drought
Grinding
petroleum products
Heavy Metals
Deficiency O₂
Flowering
Pathogens
Invasive species
Leak
Defect of pipe
GTS risk
Forecast + route
source localization
bioprofile + sample
ROV-inspection
Event = anomaly + independent confirmation by other channel
ORION22:22 / EQUILIBRIUM
Roles come together without creating a new agency
GOVERNANCE
Legal responsibility remains with the authorized bodies; the supersystem agrees on data, resources, actions and evidence.
ORION 22:22
Strategic Design and Coordination
≤ 30 MIN
EQUILIBRIUM
Digital double and control scenarios
dispatching solution
the Confirmed Threat
GASMP
Observation and early warning
SPECZASHCHITA
Pilot, Cooperative and Fleet Operator
ECO-PPA
resources, result contract and payments
≤ 6 HOURS
ESG-IR
independent verification of indicators and effect
Start of target
Robotic Mission
EUT
Compatibility of data, equipment and procedures
ORION22:22 / EQUILIBRIUM
50–100 km
PILOT
"HYDROSPHERE-1" checks the full circuit for 24 months
SYZRAN Knot VOLGA / SRATOVSKAYA WATER
ROBOTISED CELL
• Bottom and shore sensors
• Buy Gateway and Dock Station
• Long-range patrol vehicle
• maneuverable AUV and observant ROV
• mobile sampling
• the Situation Post + Digital Double
the Water System
reference section inflow load GTS underwater facility
availability
Missions without violations
source localization
Extrabudgetary
ORION22:22 / EQUILIBRIUM
The pilot goes through five control stages.
ROAD MAP
Each stage ends with the product being tested and the decision to move on.
0–3 months
4–6 months
7–12 months
13–18 months
19–24 months
Passports
Deployment
Observation
Prognosis and reaction
Verification
Borders • base line
Measurement Program
Post • robots • buoys
Communication and integration
bottom map • biota
Model Training
Warning
search for source
ESG-IR • economy
EUT Package
Passport accepted
The complex is ready
Quality confirmed
scripts worked out
decision on scale
Scales not a single robot, but a complete cell with regulations and verification
ORION22:22 / EQUILIBRIUM
Payment is related to availability, quality and effect
FINANCIAL MODEL
PILOT FINANCING STRUCTURE
PAYMENT TO THE OPERATOR
State / Regional Order
readiness and scope of services
Anchored consumers
Leasing and manufacturers
data quality and SLA
Reserve ECO-PPA
Confirmed effect
Scientific and environmental programmes
Preliminary design model; shares are specified after examination and calculation CAPEX/OPEX.
Operation: monitoring subscription • robotic inspection • emergency survey • ESG-IR-report
ORION22:22 / EQUILIBRIUM
Run 90-day pre-project phase
DECISION
The goal is to prepare the basis for the GO / NO-GO pilot "HYDROSPHERE-1".
DAYS
DAYS
DAYS
DAYS
Assign
Customer and Operator
Forming a consortium
the Scientific Council
Approve the water area,
indicators and data mode
Prepare a feasibility study, budget,
TC and ECO-PPA
Technical feasibility • economy • legal regime • cooperatives • solution GO / NO-GO
TO 90-MU DAY
ORION22:22 / EQUILIBRIUM
Sources indicated in the presentation 27
- The initial strategic concept of "HYDROSPHERE EQUILIBRIUM", 2026.
- Cover illustration: OpenAI image generation, 26.08.2026.
- [/Sources]
- WMO, State of Global Water Resources 2024: https://wmo.int/resources/publication-series/state-of-global-water-resources/state-of-global-water-resources-2024
- UN-Water, Progress on Water-related Ecosystems 2024: https://www.unwater.org/publications/progress-water-related-ecosystems-2024-update
- UN-Water, Progress on Ambient Water Quality 2024: https://www.unwater.org/publications/progress-ambient-water-quality-2024-update
- The initial strategic concept "HYDROSPHERE EQUILIBRIUM", sections 1, 11–12.
- The initial strategic concept of HYDROSPHERE EQUILIBRIUM, sections 1 and 12.
- The initial strategic concept of "HYDROSPHERE EQUILIBRIUM", figure 1 and section 5.
- GOOS 2030 Strategy: https://unesdoc.unesco.org/ark:/48223/pf0000368020
- The initial strategic concept of HYDROSPHERE EQUILIBRIUM, section 2.
- The initial strategic concept of HYDROSPHERE EQUILIBRIUM, sections 3 and 5.
- The initial strategic concept of HYDROSPHERE EQUILIBRIUM, section 6.
- The initial strategic concept "HYDROSPHERE EQUILIBRIUM", figure 2 and sections 8–9.
- NOAA Ocean Exploration, AUV overview: https://oceanexplorer.noaa.gov/technology/subs-auvs/
- ISO 20682:2026, AUV vocabulary: https://www.iso.org/standard/86398.html
- The initial strategic concept of HYDROSPHERE EQUILIBRIUM, section 10.
- IMO underwater radiated noise resources: https://glonoise.imo.org/documents/2524
- The initial strategic concept of HYDROSPHERE EQUILIBRIUM, section 7.
- GOOS Essential Ocean Variables: https://goosocean.org/what-we-do/framework/essential-ocean-variables/
- NOAA QARTOD quality assurance: https://ioos.noaa.gov/project/qartod/
- The initial strategic concept of HYDROSPHERE EQUILIBRIUM, sections 4 and 12.
- The initial strategic concept of HYDROSPHERE EQUILIBRIUM, sections 13 and 16.
- The initial strategic concept of HYDROSPHERE EQUILIBRIUM, sections 14 and 16.
- The initial strategic concept of HYDROSPHERE EQUILIBRIUM, sections 14 and 17.
- The initial strategic concept of HYDROSPHERE EQUILIBRIUM, section 15.
- The initial strategic concept of HYDROSPHERE EQUILIBRIUM, sections 14 and 17; the road map of the pre-project phase is prepared for presentation.