Brief annotation
About the document
Sees · hears · measures · recognizes · confirms
Not a separate device, but a related surveillance complex
Биоценозная_точка_мониторинга.pptx
Downloading the document...
Autonomous natural and technical complex of observation, early warning and confirmation of the environmental result
EQUILIBRIUM · SFERA · ECO‑PPA · SPECZASHCHITA
Version 1.0 · 20 August 2026
1. Definition
The biocenose monitoring point is an autonomous natural and technical complex that continuously monitors not only the individual parameters of air, water or soil, but also the state of the local ecosystem as a single living organism.
It combines environmental sensors, biological observations, photo and acoustic fixation, communication with the digital platform EQUILIBRIUM and early warning mechanisms.
2. Appointment
The point should answer five basic questions:
- What happens to the ecosystem?
- Which changes are natural and which are dangerous?
- Where is the likely source of impact?
- How does a change in one element affect the entire biocenosis?
- What actions are necessary to restore the natural balance?
The object of observation is the entire local biocenosis:
Atmosphere → water → soil → Plants → animals → Microorganisms → person → man-made load
3. Composition of the biocenous point
3.1. Atmospheric module
Controls:
- temperature and humidity;
- atmospheric pressure;
- wind speed and direction;
- Amount of rain;
- solar radiation;
- PM₁, PM₂.₅ and PM₁₀;
- CO, CO₂, NO₂, SO₂, O₃;
- methane, ammonia, hydrogen sulfide;
- volatile organic compounds;
- smoke, pollen and aerosol particles.
The module allows you to detect pollution, determine the direction of its spread and establish a link between emissions and the state of plants, animals and humans.
3.2. Soil Module
Includes sensors placed at several depths:
- temperature;
- humidity;
- pH;
- electrical conductivity;
- salinity;
- oxidation-reduction potential;
- oxygen content and CO₂;
- Groundwater level.
Laboratory analysis is carried out periodically:
- heavy metals;
- petroleum products;
- Pesticides;
- microplastics;
- organic matter;
- nitrogen, phosphorus and other nutrients;
- Composition of soil microbiota.
3.3. Water module
It is installed in the presence of a river, stream, lake, swamp, spring, well or reservoir. Measure:
- water level and temperature;
- pH;
- confusion;
- electrical conductivity;
- dissolved oxygen;
- redox potential;
- nitrate and ammonium content;
- chlorophyll;
- signs of flowering and development of cyanobacteria;
- availability of petroleum products.
The automatic sampling probe stores the samples when an anomaly is detected so that the results can be confirmed in the laboratory.
3.4. Phytomonitoring
Controls the state of the plant community:
- species composition;
- density and area of vegetation;
- flowering time, fruiting and November;
- The growth rate of trees;
- crown condition;
- humidity and temperature of the leaves;
- content of chlorophyll;
- signs of drought, diseases and damage by pests;
- accumulation of pollutants in plants.
Tools:
- phenological camera;
- multispectral camera;
- dendrometers;
- juice sensors;
- moisture sensors of the sheet;
- Periodic analysis of plant samples.
3.5. Monitoring of the animal world
Includes:
- photo traps;
- acoustic recorders;
- ultrasonic detectors of bats;
- automatic bird registration;
- registration of amphibians;
- monitoring of pollinator insects;
- hydrophones for aquatic organisms;
- registration of tracks, nests and migration routes.
Artificial intelligence pre-identifies species, estimates their number and detects behavior changes.
Particularly important are the types of indicators that respond quickly to environmental degradation:
- lichens;
- mosses;
- bees and other pollinators;
- amphibians;
- and invertebrates;
- Different types of fish and birds.
3.6. Microbiological module
Microorganisms often react to pollution before large animals and plants. Controlled by:
- composition of soil and water microbiota;
- microbiological activity of the soil;
- pathogenic microorganisms;
- processes of decomposition of organic matter;
- the appearance of toxic algae;
- Environmental DNA is eDNA.
Analysis of eDNA allows you to detect the presence of plants, animals and microorganisms by genetic traces in water, soil and air.
3.7. Physical factors
The point registers:
- noise;
- infrasound;
- vibration;
- lighting;
- light pollution;
- electromagnetic fields;
- radiation background;
- Local thermal anomalies.
This allows to take into account roads, industry, construction and infrastructure as factors of influence on biocenosis.
3.8. Visual Module
Consists of:
- observation camera;
- panoramic camera;
- thermal imager;
- phenological chamber;
- surveillance cameras of the sky;
- If necessary, a controlled drone.
Computer vision reveals:
- smoke and fire;
- cutting;
- illegal landfills;
- change in water level;
- degradation of vegetation;
- the appearance of invasive species;
- movement of animals;
- presence of equipment and people.
4. Design of point
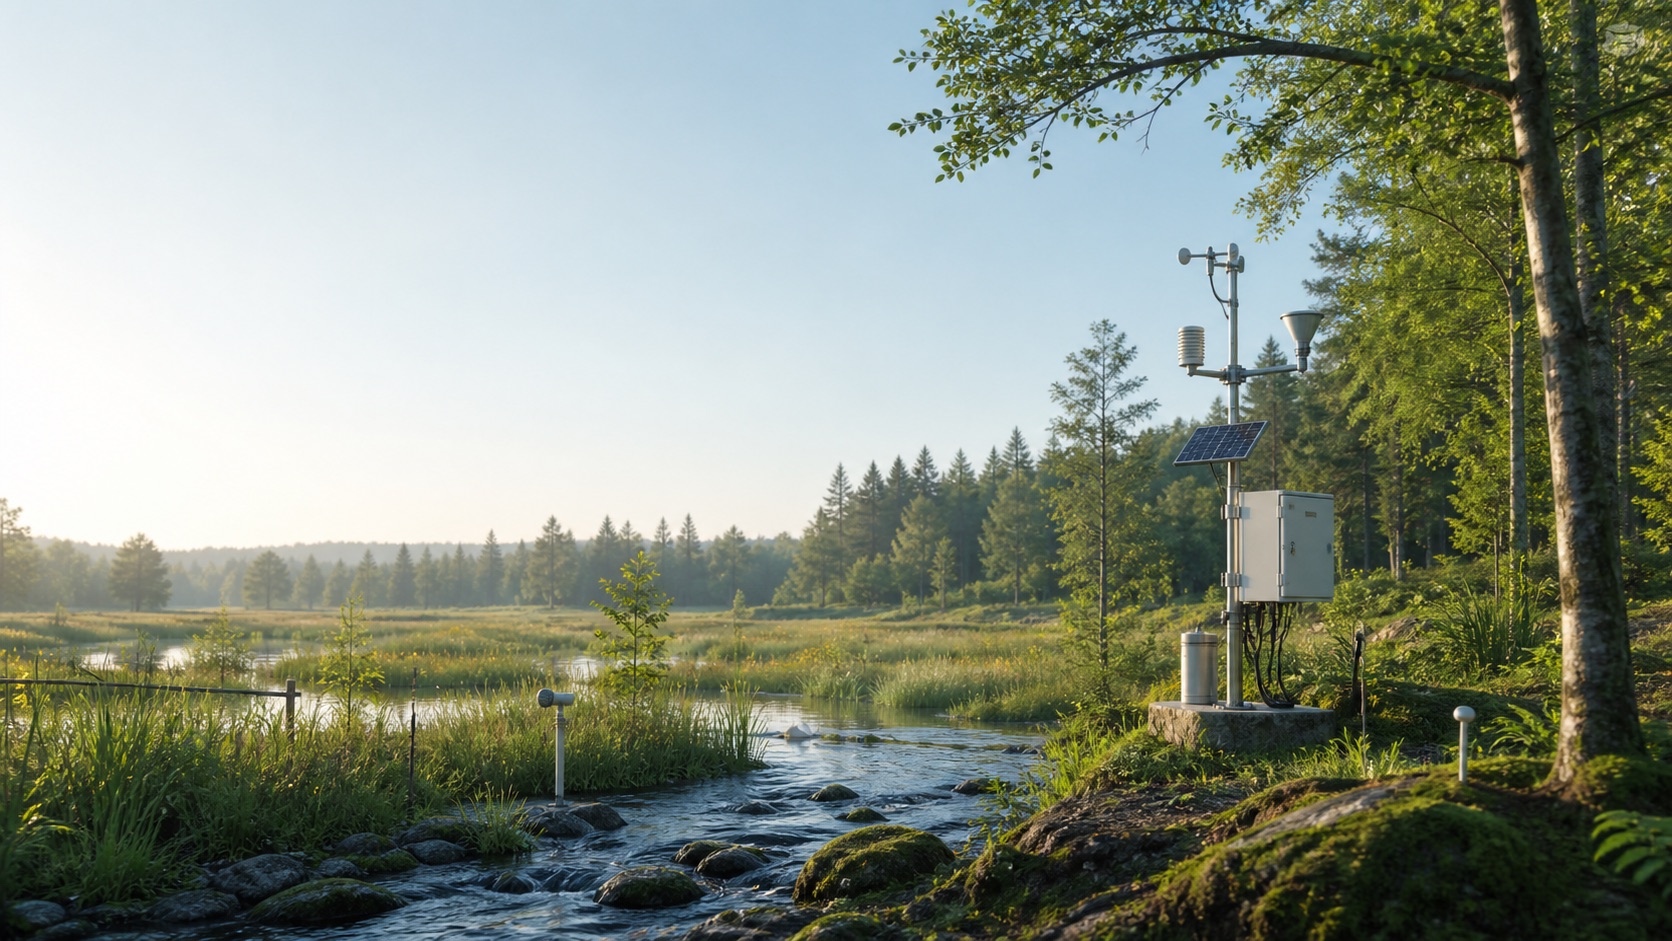
The base point is a modular mast with a height of approximately 3–10 meters with an anti-vandal body.
The composition includes:
- meteorological unit;
- gas and dust sensors;
- cameras and acoustic recorders;
- ground computing controller;
- soil probes;
- water probe in the presence of a water body;
- automatic sampling probe;
- satellite navigation;
- secure communication system;
- solar panels;
- battery;
- backup power supply;
- lightning protection;
- self-diagnosis system.
5. Working modes
The point operates in four modes.
5.1. Background Mode
It fixes natural daily, seasonal and multi-year cycles. At this stage, a digital environmental passport of the territory is formed.
5.2. High-priority regime
It is included with a steady deviation of one or more indicators from the normal range. For example:
- Decreased oxygen in water;
- Increased dust concentration;
- disappearance of the indicator type;
- unusual increase in soil temperature;
- A sharp reduction in acoustic activity of birds.
5.3. Emergency mode
It is launched in case of fire, toxic release, water pollution, radiation anomaly or mass death of organisms. Point:
- increases the frequency of measurements;
- preserves primary data;
- activates photo and video fixation;
- performs automatic sampling;
- transmits a signal to the responsible services;
- initiates a survey by a mobile laboratory or UAV.
5.4. Recovery Mode
After removing the source of exposure, the point controls whether the biocenosis returns to its original state and whether the declared result of the recovery program is achieved.
6. Biocenosis index
Instead of scattered indicators, the point forms an integral index of the state of biocenosis. It may include seven groups:
| Block | What is evaluated |
|---|---|
| Air | Clean and safe atmosphere |
| Water | Physical-chemical and biological quality |
| Soil | Fertility, pollution and microbiological activity |
| Plants | Diversity and Viability |
| Animals | Number, diversity and behaviour |
| Resilience | The ecosystem’s ability to recover |
| Pressure | Anthropogenic and technogenic load |
For each indicator, the following are retained:
- current value;
- natural range;
- speed of change;
- Seasonal norm;
- level of risk;
- Reliability of measurement;
- The alleged cause;
- necessary action.
7. Place in the system EQUILIBRIUM
The biocenose point is the primary observation node. The information and management chain is structured as follows:
- The biocenous point is primary observation and fixation.
- EQUILIBRIUM - collection, comparison, analysis and forecasting.
- The digital twin of the territory is a space-time state model.
- Early warning - detection of the threat and signal formation.
- ECO to PPA is a prevention, response or recovery program.
- SPECZASHCHITA - organization of practical execution.
- Evaluation of the result is confirmation of the change and restoration of biocenosis.
Roles of participants:
- EQUILIBRIUM observes, compares data and predicts changes.
- SFERA gathers initiatives, scientific solutions and participants.
- ECO-PPA defines a warning or recovery program.
- SPECZASHCHITA organizes practical execution.
- The biocenose point confirms the initial state, the fact of impact and the result achieved.
8. Levels of equipment
8.1. Basepoint
- weather station;
- PM₂.₅ and PM₁₀;
- CO₂;
- noise;
- radiation background;
- camera;
- soil humidity and temperature.
Suitable for mass deployment.
8.2. Expanded Point
Additionally includes:
- full gas analysis;
- soil profile;
- water multiprobe;
- photo traps;
- bioacoustics;
- thermal imager;
- automatic sampling.
Suitable for forests, water bodies, agricultural areas and sanitary protection zones.
8.3. Reference Biocenous Station
Additionally includes:
- reference analyzers;
- laboratory module;
- eDNA;
- Spectrometry;
- automated microscopy;
- UAVs;
- satellite verification;
- constant scientific support.
A reference station acts as a reference center for a network of simpler points.
9. Final model
The value of a point is determined not by the number of sensors installed, but by the ability to link measurement, biological interpretation, early warning, management action and proven environmental result into a single continuous cycle.
Biocenous point → EQUILIBRIUM → ECO‑PPA → SPECZASHCHITA → Confirmed Recovery
Source materials
Originals and versions of the document
- Биоценозная_точка_мониторинга_концепция.docxDOCX · main document
- Биоценозная_точка_мониторинга.pptxPPTX · related version
Other editions in web format
Each version is disclosed separately; the sequence of the source document is saved.
Biotic Community Monitoring PointBiocenose_point_monitoring.pptx · web text+
A territory’s “digital sensory organ”
Sees · hears · measures · recognizes · confirms
The concept of a monitoring and early response unit
EQUILIBRIUM · ECO‑PPA · SPECZASHCHITA
The point observes the ecosystem as a single living whole
BIOCENTURY MONITORING
Not a separate device, but a related surveillance complex
ATMOSPHERE
air and climate
The biocenosis point combines physical, chemical and biological data to record causal relationships within the territory.
HYDROSPHERE
water and runoff
SOIL
soil and microbiota
BIOTA
plants and animals
HUMANITY
man-made load
Result: a complete picture of the state and sustainability of biocenosis
EQUILIBRIUM · ECO‑PPA · SPECZASHCHITA
Five questions turn measurement into a management solution
BIOCENTURY MONITORING
What's changed?
Deterioration from the natural range.
Is it natural?
Comparison with daily and seasonal cycles.
Where's the source?
Connection of wind direction, runoff and technogenic events.
What's the risk?
Assessment of impacts on biota, humans and sustainability.
What do we do?
Response scenario and recovery control.
EQUILIBRIUM · ECO‑PPA · SPECZASHCHITA
The point architecture connects the seven contours of observation
BIOCENTURY MONITORING
Air
Animals
PM, gases, wind, precipitation
types, numbers, behavior, migrations
Water
Physical Fields
pH, oxygen, turbidity, biogens
noise, vibration, light, radiation
Soil
Visual control
humidity, pH, salts, groundwater
camera, thermal imager, drone
Plants
growth, chlorophyll, stress, phenology
EQUILIBRIUM · ECO‑PPA · SPECZASHCHITA
One autonomous node works in the field all year round
BIOCENTURY MONITORING
Soil Profile
probes at several depths
FIELD DESIGN
Mast 3–10 m
Water circuit
multiprobe and auto-sampling
Meteoblok · gas and dust sensors · Camera · Acoustics · Local Computer
Edge Analytics
Detection of anomalies on the spot
Solar Panels
Battery and reserve
Secure communication
Self-diagnosis
Contact
LoRaWAN · NB‑IoT · 4G/5G · satellite
EQUILIBRIUM · ECO‑PPA · SPECZASHCHITA
Four modes provide a full cycle of control
BIOCENTURY MONITORING
Background
Increased attention
Emergency
Restorative
It forms an environmental passport and natural ranges.
Increases measurements with a steady deviation.
It records an event, takes a sample, and transmits an alarm.
Confirms the return of the system to a stable state.
It is not enough to measure - the system must determine the moment of transition to action.
EQUILIBRIUM · ECO‑PPA · SPECZASHCHITA
From signal to confirmed environmental result
BIOCENTURY MONITORING
SIGNAL
VERIFICATION
SOURCE
RESPONSE
RECONSTRUCTION
Sensor detects deviation
Calibration and confirmatory test
The model determines the probable cause
Services implement action plan
The point proves the effect achieved
The data preserves time, coordinates, instrument, calibration and quality status.
EQUILIBRIUM · ECO‑PPA · SPECZASHCHITA
The biocenose index shows the balance, without hiding the primary data
BIOCENTURY MONITORING
AIR
WATER
current value
natural range
Interconnected blocks
SOIL
BIOTA
change rate
Seasonal norm
Air · water · soil · Plants · animals · Sustainability · anthropogenic pressure
SUSTAINABILITY
PRESSURE
Level of risk
probable cause
Index - navigation for decisions. Evidence is provided by initial measurements and laboratory verification.
EQUILIBRIUM · ECO‑PPA · SPECZASHCHITA
The point becomes the primary node of a large execution system
BIOCENTURY MONITORING
BIOCENOSIS
POINT
EQUILIBRIUM
ECO‑PPA
SPECZASHCHITA
Watching
Analyzing
defines actions
organizes execution
Digital double territory · warning · proven result
SFERA incorporates initiatives, scientific solutions and cooperation participants.
EQUILIBRIUM · ECO‑PPA · SPECZASHCHITA
Three levels of equipment allow scaling the network
BIOCENTURY MONITORING
BASIC
EXPANDED
REFERENCE
Mass coverage
Problem areas
Support Scientific Center
Meteo · PM · CO₂ · Noise · Radiation · camera · soil
Gases · water probe · photo trap · bioacoustics · thermal imager · car test
Reference analyzers · Laboratory · eDNA · Spectrometry · UAVs
Network principle: mass point density + accuracy of reference stations.
EQUILIBRIUM · ECO‑PPA · SPECZASHCHITA
Pilot in 90 days creates measurable territory contour
BIOCENTURY MONITORING
0–15
DESIGN
Boundaries of biocenosis, risks, indicators, installation sites.
16–45
DEVELOPING
Installation of points, communication, primary calibration, training.
46–75
BASIC LINE
Formation of natural ranges and digital passport.
76–90
VERIFICATION
Alarm test, mobile verification, report and scaling plan.
The result of the pilot: a working network, a passport of the territory, a response regulation and a confirmed methodology.
EQUILIBRIUM · ECO‑PPA · SPECZASHCHITA
THE TERRITORY GETS THE OWN BODY OF FEELINGS
See
Heard
Measurable
Detects
Confirms
The biocenose point makes the ecological balance observable, manageable, and provable.
The next step is to select a pilot territory and fix the composition of the base line.
EQUILIBRIUM · ECO‑PPA · SPECZASHCHITA
Sources indicated in the presentation 3
- The visual image was created by OpenAI on the author’s concept of a biocenous monitoring point.
- The concept is designed for the system EQUILIBRIUM / ECO‑PPA.
- EPA Water Sensors Toolbox; WHO Global Air Quality Guidelines; USGS Continuous Water-Quality Monitoring guidance.