Brief annotation
About the document
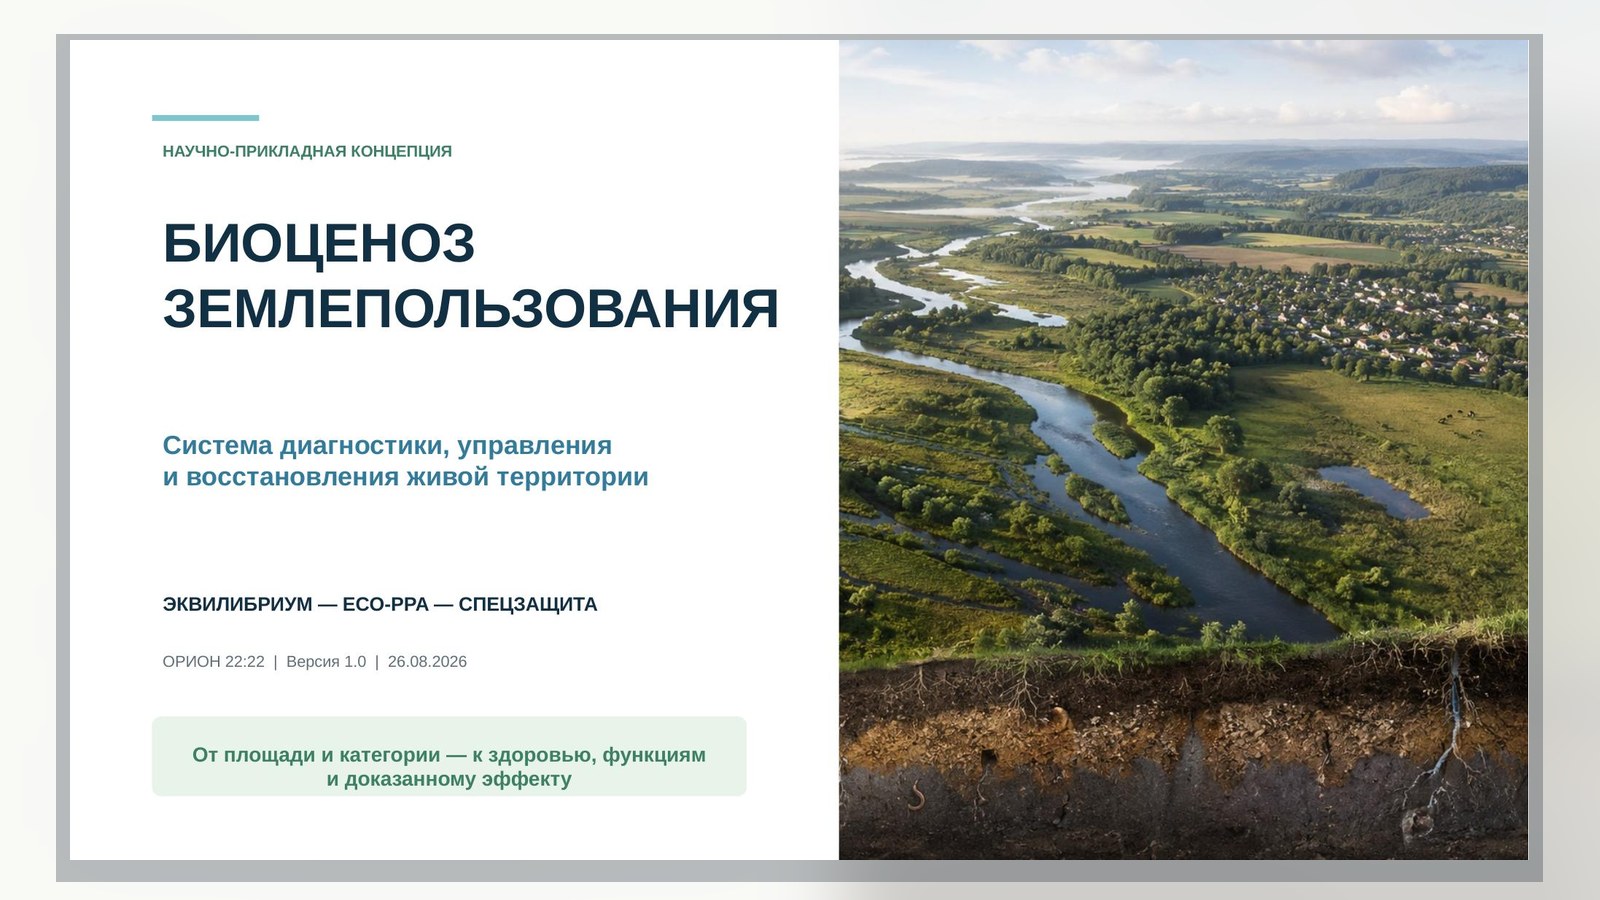
Model of coordination of land use, ecology, production and long-term development of the territory.
Биоценоз_Землепользования_Презентация.pptx
Downloading the document...
EQUILIBRIUM — ECO-PPA — SPECZASHCHITA
Project ORION22:22 | Version 1.0
26 August 2026
The concept offers a single evidence-based contour: cadastral and legal status is maintained as an independent layer, environmental status is assessed according to a relevant baseline, and each activity is associated with a source of pressure, responsible, cost and verifiable result.
1. Summary for decision
"Earth Use Biocenosis" is a project of the system of diagnostics, management and restoration of living territory in the architecture EQUILIBRIUM - ECO-PPA - SPECZASHCHITA. Its task is to turn scattered cadastral, natural, production and investment information into a verifiable cycle of decisions.
1.1. What the customer receives
- digital passport of the territory, linking the site, landscape, catchment and history of impacts;
- a baseline of soil, water, vegetation and habitats, indicating methods and uncertainties;
- atlas of threats and a priority map, where the risk and confidence of the diagnosis are separately shown;
- portfolio of events ECO-PPA with responsible, resources, KPI and independent verification;
- re-observation rules that allow you to prove the effect or change the measure in a timely manner.
1.2. First-level solution
It is recommended to approve the 60-day pre-project stage: choose the territory and the leading problem, determine the customer and scientific partner, agree on access to data and sites, design the baseline, budget and criteria for the transition to the 12-month pilot.
2. Scientific status and working definition
2.1. Working definition
"Land use biocenosis" is a natural and economic system of the territory, including soil and soil biota, water, vegetation, animals and microorganisms, relief and climatic processes, legal regime and actual use, sources of load, objects of influence and mechanisms of management of the result.
2.2. Key distinctions
| Concept | Use in concept |
|---|---|
| Land plot | legally defined object with boundaries, rights and mode of use |
| Land use | Method and regime of land use by people and organizations |
| Land cover | observed physical cover: forest, arable land, water, development, open ground |
| Soil biocenosis | a community of organisms related to the soil environment and its functions |
| Landscape / catchment | environmental contour, which often crosses cadastral and administrative boundaries |
| Digital passport | analytical layer; does not replace EGRN and legally significant procedures |
3. The problem of fragmentary management
Cadastral accounting answers primarily to questions of object and law; environmental monitoring - to questions of the state of the environment; agronomic and production data - to questions of technology and yield; investment documents - to questions of resources and payback. Without a common identifier, time, scale and methodology, this information does not constitute proof of cause or effect.
| Gap | Management consequence |
|---|---|
| Boundaries | cadastral site does not coincide with the catchment, habitat or transfer area |
| Time Gap | One-time surveys do not show seasonality and trend |
| Fracture of methods | satellite feature is taken as a confirmed state without ground inspection |
| Gap in decisions | the event is not related to the baseline, control area and responsible |
| The economic gap | costs are fixed, but the unit cost of the confirmed result is not calculated |
4. Purpose, objectives and issues of the system
The strategic goal is to ensure the evidential preservation and restoration of land functions with the legitimate and economically justified use of the territory.
- What is happening to the territory and what is the reliability of this conclusion?
- What changes are natural, seasonal or caused by economic stress?
- Where is the likely source of the pressure and what alternative explanations remain?
- How are soil, water, vegetation, habitats and land users affected?
- Which action has the best ratio of urgency, effect, cost and risk?
- Did the package of measures give a measurable result relative to the baseline and the comparison site?
5. Control object and spatial scales
The system maintains several compatible, but not interchangeable, circuits. The decision is made on the scale at which the process exists: law at the site level, erosion runoff at the slope and catchment level, habitat connectivity at the landscape level, and policy at the municipal or regional level.
| Scale | Key management issue |
|---|---|
| Site | rights, permitted use, local soil and economic data |
| Field / quarter | technological unit, actual cover, local measures |
| Slope / catchment | erosion, runoff, flooding, pollution transfer |
| Location / Corridor | biodiversity, fragmentation, invasive species |
| Municipality | spatial planning, infrastructure, balance of interests |
| Region | comparable standards, inter-municipal flows and recovery programme |
6. Principles and evidence
- a relevant baseline instead of a universal benchmark for all types of land;
- separation of observation, diagnosis, hypothesis of cause and legally significant fact;
- ground verification of remote signs and traceability of samples;
- action hierarchy: prevent → reduce → recover → compensate residual effect;
- level of confidence next to each risk and forecast;
- independent verification of significant results and preservation of version history;
- The algorithm does not establish the right and does not replace the powers of the authorities.
7. Baseline and typology of the territory
The baseline is formed before the selection of environmental targets KPI. The territory is stratified by natural area, terrain, soils, moisture, cover, history of use, intensity of load and legal regime. Comparisons are made only within comparable classes.
| Block | Mandatory information |
|---|---|
| Right and Identity | cadastral number, category, IRR, rights, restrictions, zones with special conditions |
| Natural basis | geology, relief, climate, soils, catchment, background ecosystems |
| Covering and use | actual cover, culture/forest/building, history of changes |
| Loads | processing, grazing, construction, pollution, water collection, fires, recreation |
| Receptors | soil, water, habitats, population, economic objects |
| Trust | source, date, method, resolution, error, completeness and verification status |
8. Soil and soil biocenosis
Soil is assessed as an environment that provides productivity, circulation of substances, water regulation, carbon storage and habitat of organisms. The set of indicators depends on site function and threats; one measurement does not fully describe “soil health.”
| Contour | Examples of indicators |
|---|---|
| Physics | granulometric composition, density, sealing, aggregate stability, infiltration, erosion |
| Chemistry | pH, organic carbon/substance, nutrients, salinity, target pollutants |
| Biology | microbial biomass/breathing, soil fauna, roots, functional indicators |
| Mode | humidity, temperature, freezing, overmoistening, drought |
| Data quality | depth and selection scheme, season, laboratory, control samples, uncertainty |
9. Water, vegetation and biodiversity
9.1. Hydrological regime
Humidity and infiltration, surface runoff, groundwater, flooding and drying, coastal strip condition and catchment transport are assessed. The local measure is checked for no downstream transfer of damage.
9.2. Vegetation and habitats
Soil cover, seasonal productivity, tree and grass vegetation structure, agrocenose condition, fragmentation and habitat connectivity are considered with respect to the type of territory. The growth of species does not always mean improvement: the standard, functions and invasive species are important.
9.3. Climatic loads
Drought, extreme precipitation, heat, wind, freezing and fire hazards are included as external conditions affecting the risk and interpretation of the result. One season does not form a multi-year climate norm.
10. Law, cadastre and restrictions
In the Russian Federation, the legal regime is determined by the category of land, permitted use and special restrictions. State monitoring of lands and EGRN have their own powers and legal significance. The project passport uses this information as sources and does not replace them.
| Legal layer | Usage Rule |
|---|---|
| Category and IRI | permissible purposes and mode of use; checked for current official information |
| Rights and encumbrances | property, rent, easements, other restrictions |
| Boundaries | quality of coordinates, intersections, actual use behind the contour |
| ZOUIT and Security | sanitary, water protection, environmental and other special regimes |
| Credentials | what body establishes the fact, issues an order or makes a decision |
11. Threat Atlas and Causal Chains
| Threat | Probable chain | Main effect |
|---|---|---|
| Erosion | open ground + Slope + stock/wind | loss of the upper horizon, silting water |
| Seal | machinery, grazing, construction | reduction of infiltration and root volume |
| Loss of organic matter | Disruption of the balance of receipt and mineralization | Decreased structure and sustainability |
| Salting / Moisturizing | water regime, reclamation, groundwater | Productivity constraints and community change |
| Pollution | industry, waste, agrochemicals | Toxic effects and limitations of use |
| Soil sealing | Construction and coverage | loss of functions, growth of runoff and overheating |
| Fragmentation / Invasion | roads, clearing, drifting species | loss of connectivity and ecosystem change |
Each threat card contains an observable signal, alternative explanations, the subject of the impact, urgency, level of confidence, necessary verification, and permissible actions. The reason is not considered confirmed only by spatial correlation.
12. System of indicators
| Block | Key indicators |
|---|---|
| Covering and use | classes of cover; actual use; modification; proportion of sealed surface |
| Productivity | seasonal dynamics of vegetation; yield/biomass adjusted for weather |
| Soil carbon | stock and concentration by standardized depth; density and uncertainty |
| Physics of soil | sealing; infiltration; aggregate stability; erosion vulnerability |
| Chemistry of soil | pH; salts; nutrients; target pollutants |
| Biology | biological activity; indicator groups; habitat status |
| Water | humidity; runoff; flooding; water quality according to the target program |
| Right | Category/IRI compliance; limits; quality of borders; conflicts identified |
| Management | reaction time; execution of measures; result before/after/control; residual risk |
13. Observation Network and Quality Control
The architecture is built on the principle of "review → stratification → ground check → laboratory confirmation → re-observation". Remote sensing provides coverage but does not replace field diagnosis.
| Contour | Role |
|---|---|
| Satellites | cover, seasonal dynamics, humidity/surface temperature, signs of changes |
| UAVs | local detailing, relief, erosion forms, cover and objects |
| Field routes | description of soils, vegetation, loads and photo fixation |
| Support areas | Re-measurement and calibration of distance signs |
| Laboratory | confirmation of physical, chemical and biological indicators |
| Cadastre and business data | legal regime, borders, transactions and history of use |
- Stratified sampling design and documented representativeness;
- field duplicates, blanks and control samples, where applicable;
- single units, coordinates, time, depth, method and storage chain;
- Calibration of models by independent sample and publication of the error matrix;
- versioning of algorithms, the prohibition of hidden correction of source data.
14. Digital passport and architecture EQUILIBRIUM
The passport combines the legal identifier and the environmental contour, but keeps their origin and status separately. The hypergraph EQUILIBRIUM links the site, observation, sample, source, threat, event, performer, cost, and proof of outcome.
| Passport section | Contents |
|---|---|
| Identity | plot, economic unit, landscape, catchment, version of borders |
| Base Line | soil, water, cover, vegetation, habitats, climatic loads |
| Observation | date, coordinates, method, source, accuracy, status QA/QC |
| Diagnosis | threat, perceived cause, alternatives, risk and confidence |
| Action | measure, responsible, budget, timing, permissions and stop conditions |
| Result | before/after/control, effect, residual risk, independent verification |
| Access | roles, change log, protection of sensitive and commercial data |
15. Diagnostics and management cycle
- Inventory of the site and the ecological contour.
- Check the quality and comparability of the original data.
- Identify the change and form several causal hypotheses.
- Confirm priority areas by field and laboratory.
- Assess risk, urgency, confidence and interests affected.
- Select an action in the hierarchy of prevention, reduction and recovery.
- Complete package ECO-PPA with resources and results criteria.
- Compare the result with the baseline and the comparison area.
- Update your passport, risk model, and next cycle decision.
16. ECO-PPA: portfolio of activities and economy
ECO-PPA translates the diagnosis into a project where the environmental result is related to the beneficiaries, payer, capital and operating costs, duration, uncertainty and method of verification. Before the baseline survey, neither effect nor profitability is guaranteed.
| Issue addressed | Examples of measures | Verification of the result |
|---|---|---|
| Erosion | cover crops, forest strips, contour organization, drainage | coating, flushing/deletion, condition of the water intake |
| Seal | restricted passages, controlled traffic, restoration of structure | Density, resistance, infiltration |
| Water Mode | buffer strips, drainage/moisture recovery, drain retention | humidity, runoff, flooding, water quality |
| Pollution | source localization, removal/isolation, remediation by project | concentration, area, migration, residual risk |
| Habitats | corridors, restoration of cover, control of invasions | coherence, indicator types, sustainability |
17. Distribution of roles
| Participant | Responsibility |
|---|---|
| EQUILIBRIUM | integration of data, passports, hypergraph, diagnostics, scenarios and evidence |
| ECO-PPA | portfolio design, resources, financing, KPI and verification |
| SPECZASHCHITA | surveys, cooperation of performers, field and rehabilitation work |
| Authorities | authority, official data, coordination and legally significant decisions |
| Land users | access, history of operations, implementation and operational feedback |
| Scientific Council and Laboratory | methods, observation design, quality and interpretation |
| Independent Validator | Checking the baseline, methods, result and limitations of the conclusions |
18. Pilot for 12 months
| Months | Stage | Result |
|---|---|---|
| 0–2 | Pre-project | territory, problem, customer, data agreements, base line design |
| 2–4 | Inventory | archival, satellite, cadastral and economic data; stratification |
| 3–6 | Field and laboratory | seasonally permissible surveys, reference sites, QA/QC |
| 5–7 | Passports and Atlas | digital passports, threat map, priorities and causal hypotheses |
| 7–10 | Actions | 2–4 Types of site interventions and comparisons |
| 10–12 | Verification | re-observations, economics, independent audit and decision to continue |
| 13–36 | Long cycle | multi-season check of recovery, productivity and carbon effects |
19. KPI, scaling risks and criteria
19.1. Project KPI for discussion
| Block | Purpose of the pilot |
|---|---|
| Data | ≥95% required passport fields; ≥90% valid support contour sets |
| Verification | 100% critical anomalies have check card and solution |
| Boundaries | consistency of cadastral and actual contours assessed for the entire pilot sample |
| Decisions | at least three packages ECO-PPA with responsible, budget and verification method |
| Effect | change in the leading indicator is estimated relative to the baseline and the comparison area |
| Security | Absence of confirmed transfer of damage to neighboring territory |
19.2. Main risks
| Risk | Control measure |
|---|---|
| Mixing law and ecology | separate data statuses; legal conclusions only by the competent authority |
| Misdiagnosis by image | ground-based verification and error matrix |
| Seasonality | comparable time and follow-up 24–36 months |
| False Causality | time series, comparison area and alternative hypotheses |
| Carbon Promises | separate recognized methodology and independent verification |
| Closed Data | role access, aggregation, contracts and logging |
| Conflict of interest | separation of the performer and the validator |
20. Roadmap, solution and sources
20.1. Scaling
| Horizon | Benchmark |
|---|---|
| 0–2 months | pre-project: territory, methodology, data, budget, partners |
| 3–14 months | 12-month pilot and independent audit |
| 15–36 months | multi-season surveillance and a network of different types of pilots |
| 37–48 months | Regional standard for passports and data exchange |
| 49–60 months | national network and pairing with GASMP "EQUILIBRIUM" |
20.2. Decision
Approve 60-day pre-project stage; appoint the customer and the working group; choose the pilot territory; form a list of official and household data; agree on field access; submit the pilot's passport, budget, quality plan and criteria for transition to 12-month stage.
20.3. Main sources
[1] Land Code of the Russian Federation No. 136-FZ. Official text: https://pravo.gov.ru/proxy/ips/?docbody=&nd=102073184
[2] Federal Law No. 218-FZ "On State Registration of Real Estate": https://pravo.gov.ru/proxy/ips/?docbody=&nd=102376335
[3] Order of Rosreestr from 22.07.2021 No P/0315 on state monitoring of lands: https://publication.pravo.gov.ru/Document/View/0001202112100058
[4the Order of Rosreestr 23.08.2024 No P/0267/24 Changes in the current c 01.03.2025: https://publication.pravo.gov.ru/document/0001202411210029
[5] Federal Law No. 101-FZ "On ensuring the fertility of agricultural land": https://pravo.gov.ru/proxy/ips/?docbody=&nd=102054366
[6] Order of the Ministry of Agriculture of Russia 24.12.2015 № 664 the Monitoring of Agricultural Lands: https://publication.pravo.gov.ru/document/0001201603230036
[7] Water Code of the Russian Federation 74-FZ: https://pravo.gov.ru/proxy/ips/?docbody=&nd=102107048
[8] FAO/ITPS. Towards a definition of soil health: https://openknowledge.fao.org/server/api/core/bitstreams/ffb5feaf-8388-4e2f-b319-2260a9a6f5a2/content
[9] FAO. Global Soil Health Indicators and Assessment: https://www.fao.org/soils-portal/soil-degradation-restoration/global-soil-health-indicators-and-assessment/en/
[10] FAO. Soil Degradation and Restoration: https://www.fao.org/soils-portal/soil-degradation-restoration/en/
[11] UNCCD. Land Degradation Neutrality overview: https://www.unccd.int/land-and-life/land-degradation-neutrality/overview
[12] UNCCD. Scientific Conceptual Framework for Land Degradation Neutrality: https://www.unccd.int/land-and-life/land-degradation-neutrality/ldn-conceptual-framework
[13] UNEP. SDG indicator 15.3.1 and its three subindicators: https://sdgs.unep.org/article/sdg-indicator-1531
[14] IPBES. Assessment Report on Land Degradation and Restoration (2018): https://digitallibrary.un.org/record/3794559?ln=en
[15] Directive (EU) 2025/2360 — Soil Monitoring Law; international benchmark, not Russian law: https://eur-lex.europa.eu/eli/dir/2025/2360/oj/eng
[16] Copernicus Land Monitoring Service: https://land.copernicus.eu/en
[17] Copernicus Data Space. Sentinel-2 mission parameters: https://dataspace.copernicus.eu/data-collections/copernicus-sentinel-missions/sentinel-2
[18] OECD. Land cover change indicator: https://www.oecd.org/en/data/indicators/land-cover-change.html
Source materials
Originals and versions of the document
- Биоценоз_Землепользования_Концепция.docxDOCX · main document
- Биоценоз_Землепользования_Презентация.pptxPPTX · related version
Other editions in web format
Each version is disclosed separately; the sequence of the source document is saved.
BIOCENOSIS OF LAND USEBiocenosis_Land Use_Presentation.pptx · web text+
System of diagnostics, management and restoration of living territory
EQUILIBRIUM — ECO-PPA — SPECZASHCHITA
ORION22:22 | Version 1.0 | 26.08.2026
From area and category to health, function and proven effect
The survey does not show the health of the area
SCIENTIFIC AND CRAFTS CONCEPT
WHAT THE STUDY SEES
WHAT IS NEEDED FOR MANAGEMENT
Borders and Square
Land category
type of permitted use
rights holder and restrictions
erosion and sealing
water and organic matter
vegetation and habitats
load, risk and result of measures
NO
DIAGNOSIS
Cadastral information is necessary, but the ecological state requires a separate evidence circuit.
BIOCENOSIS OF LAND USE
Project name combines scientific terms
SCIENTIFIC AND CRAFTS CONCEPT
IMPORTANT BIOCENOSIS
"BIOCENOSIS OF LAND USE"
Organisms and connections in the soil
Umbrella project concept: connects natural processes, economic use, law and management.
ECOSYSTEM / LANDSCAPE
functions and spatial flows
AGROCENOSIS
Managed Agricultural Community
SOCIO-ECOLOGICAL SYSTEM
People, Institutions and Nature
The Living Earth is a management metaphor, not a substitute for scientific and legal definitions.
BIOCENOSIS OF LAND USE
The territory lives in two contours at once
SCIENTIFIC AND CRAFTS CONCEPT
Cadastre and law
ENVIRONMENTAL AND LANDSCAPE
Land and Law
Category and WRI
Limitations and encumbrances
Oversight and formal procedures
slope and catchment
soil-water flows
Habitats and Corridors
Impacts Abroad
DIGITAL
PASSPORT
Connects the contours
The passport does not replace the EGRN and legally significant procedures.
BIOCENOSIS OF LAND USE
Monitoring is closed in the management cycle
SCIENTIFIC AND CRAFTS CONCEPT
DESCRIPTION
DIAGNOSIS
PRIORITY
MEASURES
TRAINING
PASSPORT
VERIFICATION
ACTION
Each measure ends with an effect check and an update of the knowledge of the territory.
BIOCENOSIS OF LAND USE
Nine layers form the territory passport
SCIENTIFIC AND CRAFTS CONCEPT
LAW
POKROV
RELIEF + WATER
Boundaries •
land • building
slopes • stock
SOIL: PHYSICS
SOIL: CHEMICAL
PAINTING: BIOLOGY
Structure • Density
pH • salt • pollution
Breathing • Biota
VEGETABLES
LOCATIONS
LOAD + MEASURES
State • Phenology
Connectivity • species
Operation • Cost • Effect
The layer stores the source, date, method, accuracy, and status of the evidence.
BIOCENOSIS OF LAND USE
Processes go beyond the boundaries of the site
SCIENTIFIC AND CRAFTS CONCEPT
PLATFORM
Right • operation • local sample
FIELD / QUARTAL
homogeneous control area
WALL / WATER
runoff • erosion • substance transfer
LOCATION CORRIDOR
Connectivity and migration of species
MUNICIPALITY / REGION
Land use balance and scenarios
Decision unit ≠ unit of process
BIOCENOSIS OF LAND USE
The indicator panel does not hide risks
SCIENTIFIC AND CRAFTS CONCEPT
BASIC NUCLEAR SDG 15.3.1
POKROV
PRODUCTIVITY
ORGANIC HYDROGEN
Change of classes
Vegetation dynamics
Stocks in soil
+ LOCAL DIAGNOSTICS
erosion and sealing
water and salinization
Soil Biota
Connectivity of habitats
pollution
legal status
The integral index does not replace the initial signals, thresholds and uncertainty.
BIOCENOSIS OF LAND USE
Satellite gives an overview - the field confirms the diagnosis
SCIENTIFIC AND CRAFTS CONCEPT
DZZ
Fields
Cover • Humidity • Dynamics
section • sample • bioindication
SINGLE
MODEL
TERRITORIES
DRON / MOBILE CONTOUR
LABORATORY +
Details • routes
Confirmation • Right • History
ERS identifies areas of focus, but does not replace field and laboratory measurements.
BIOCENOSIS OF LAND USE
EQUILIBRIUM Linking Site, Threat and Result
SCIENTIFIC AND CRAFTS CONCEPT
RECEIVED
Remote sensing • field • laboratory • registers
QUALITY
method • date • coordinates • errors
REFERENCE
plot ↔ slope ↔ catchment ↔ habitat
DIAGNOSTICS
anomaly • cause • confidence
SCENARIUM
without action • measure • residual risk
ECO-PPA
project • resources • term • performer
VERIFICATION
before / after / control • passport
BIOCENOSIS OF LAND USE
Atlas of Threats Turns Signal into Hypothesis
SCIENTIFIC AND CRAFTS CONCEPT
EROSIA
Nude • Moths • Takeaway
SIGNAL
WEATHER
gauge • density • infiltration
CAUSE OF HYPOTHESIS
THE LOSS OF ORGANICS
carbon • structure • biota
FIELD CHECK
ASSOCIATION / MOVEMENT
Salt • water • relief
PRIORITY OF MEASURES
POLLUTION / INQUIRY
source • area • receptor
FRAGMENTATION / INVASION
corridors • kinds • dynamics
Statuses: observation → hypothesis → confirmation
BIOCENOSIS OF LAND USE
Hierarchy of actions protects against false compensation
SCIENTIFIC AND CRAFTS CONCEPT
AVOID
REMOVE
Do not create a new degradation
RECONSTRUCTION
Reduce the current pressure
COMPENSATE THE FACILITY
return functions on disturbed ground
Only proven residual damage
Compensation should not justify preventable damage.
BIOCENOSIS OF LAND USE
Roles are divided - proof independently
SCIENTIFIC AND CRAFTS CONCEPT
EQUILIBRIUM
data • hypergraph • diagnostic • scenarios
ECO-PPA
portfolio of measures • resources • KPI • verification
SPECZASHCHITA
survey • field work • execution
STATE / LAWYER
Formal decisions within the scope of authority
SCIENCE + LABORATORY
Methods • analysis • independent control
The executor of the measure does not substitute for independent verification of the result.
BIOCENOSIS OF LAND USE
Pilot checks system for 12 months
SCIENTIFIC AND CRAFTS CONCEPT
FRAME
BASIC LINE
DIAGNOSIS
DRAFT MEASURES
IMPLEMENTING
VERIFICATION
9–10
11–12
Borders •
Remote sensing • field • registers
• reasons
ECO-PPA • resources
2–3 Leading measures
before / after • audit
base line • atlas threats • digital passport • verified measures • plan 24–36 months
Result package
The annual pilot does not prove long-term soil restoration and carbon effect.
BIOCENOSIS OF LAND USE
100%
SCIENTIFIC AND CRAFTS CONCEPT
Success is data quality and proven effect
PROJECT OBJECTIVES FOR DISCUSSION
Valid Records
the reference contour
Priority threats
Checked
The measures have a design
before / after / control
Initial signals and uncertainty are available
The effect is compared to the baseline and control
Each threat has a cause and a status of evidence.
long-term trends put into monitoring 24–36 months
Values are the goals of the pilot, not the results already achieved.
BIOCENOSIS OF LAND USE
Launch the pre-project stage
DECISION
DAYS
Results of the stage
pilot territory and ecological contour
Register of data, gaps and rights holders
Scientific protocol and quality plan
BIOCENOSIS
LAND USE
Observations, roles and verifications
Measure → Understand → Change → Prove
passport 12-month pilot ECO-PPA
EQUILIBRIUM — ECO-PPA — SPECZASHCHITA
ORION 22:22
Sources indicated in the presentation 25
- Visual: original OpenAI ImageGen scientific editorial illustration generated for this deck, 2026-08-26.
- Land Code of the Russian Federation: https://pravo.gov.ru/proxy/ips/?docbody=&nd=102073184
- FAO Sustainable Land Management: https://www.fao.org/land-water/land/sustainable-land-management/en/
- FAO Voluntary Guidelines for Sustainable Soil Management: https://openknowledge.fao.org/server/api/core/bitstreams/9a5b9373-3558-43b3-b732-f69326a7314d/content
- IPBES Land Degradation and Restoration Assessment: https://ict.ipbes.net/ipbes-ict-guide/data-and-knowledge-management/citations-of-ipbes-assessments/land-degradation-assessment
- Project terminology; the umbrella term is explicitly distinguished from formal scientific concepts.
- Rosreestr — state land supervision: https://rosreestr.gov.ru/activity/gosudarstvennyy-nadzor/gosudarstvennyy-zemelnyy-kontrol-nadzor/
- UNCCD LDN conceptual framework: https://www.unccd.int/land-and-life/land-degradation-neutrality/ldn-conceptual-framework
- Project operating model; no external quantitative claim.
- Copernicus Land Monitoring Service: https://land.copernicus.eu/
- Project digital passport layer model.
- UN SDG indicator 15.3.1 metadata: https://unstats.un.org/sdgs/metadata/?Goal=15&Target=&Text=
- FAO Global Soil Organic Carbon Map: https://www.fao.org/soils-portal/data-hub/soil-maps-and-databases/global-soil-organic-carbon-map-gsocmap/en/
- Local diagnostic panel is a project proposal.
- Copernicus CORINE Land Cover: https://land.copernicus.eu/en/products/corine-land-cover
- Rosreestr — national reports: https://rosreestr.gov.ru/activity/gosudarstvennoe-upravlenie-v-sfere-ispolzovaniya-i-okhrany-zemel/gosudarstvennyy-natsionalnyy-doklad-o-sostoyanii-i-okhrany-zemel-rossiyskoy-federatsii/
- Project-specific semantic and evidence architecture.
- FAO Soil Degradation & Restoration: https://www.fao.org/soils-portal/soil-degradation-restoration/en/
- Threat taxonomy is a project diagnostic framework.
- UNCCD Land Degradation Neutrality overview: https://www.unccd.int/land-and-life/land-degradation-neutrality/overview
- CBD Global Biodiversity Framework, Target 2: https://www.cbd.int/gbf/targets/2
- Project governance proposal; official powers remain with competent authorities.
- Project pilot roadmap and assumptions; measures and duration require site-specific approval.
- All KPI values shown are project targets for discussion, not externally validated outcomes.
- Project decision proposal; no external quantitative claim.