Brief annotation
About the document
A concept for a system combining nature and technology to monitor and restore the air environment.
Биоценоз_Воздух_Презентация.pptx
Downloading the document...
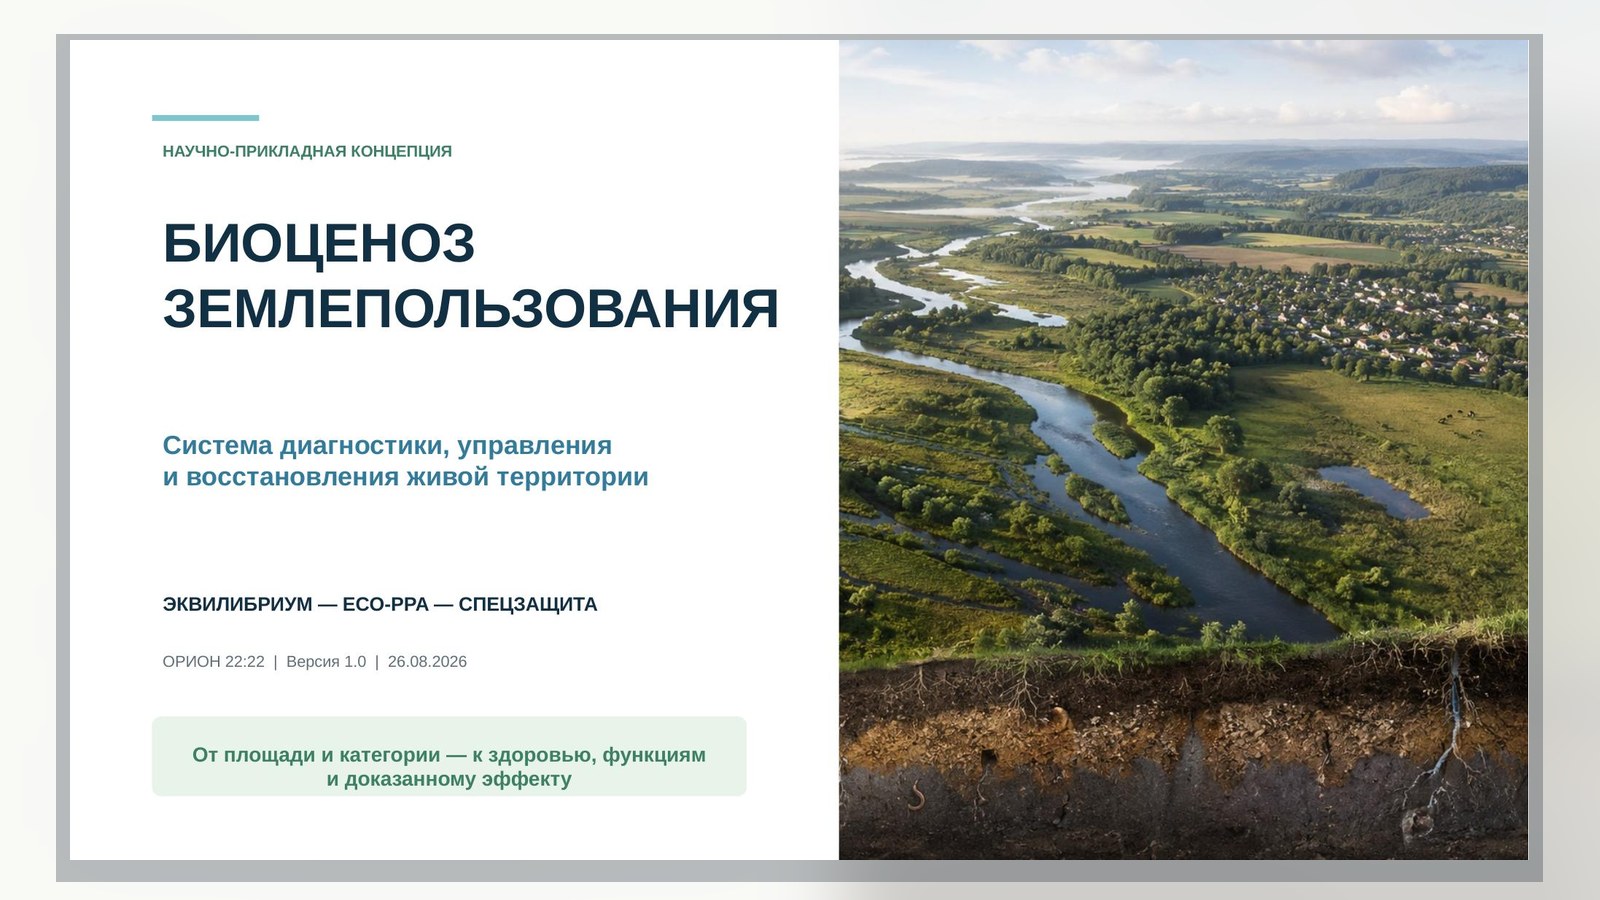
EQUILIBRIUM — ECO-PPA — SPECZASHCHITA
Project ORION22:22 | Version 1.0
26 August 2026
SUMMARY FOR DECISIONS
"Biocenosis: Air" transfers atmospheric monitoring from the mode of fixing individual excesses to the mode of early warning, determining the likely source, forecasting the transfer, assessing the impact and verifying the result of the measures taken. The system complements, but does not replace, state environmental, sanitary and hydrometeorological control.
The scientifically accurate core of the project is the monitoring of the aerobic, bioaerosols and physico-chemical matrix of the air environment. The term "biocenosis" is retained as a strong project name, with the document directly delineating the detection of a biological marker, viability, activity, infectiousness, and real risk.
Six management issues
- What is happening to the air now?
- Is the change natural, seasonal, or dangerous?
- Where is the likely source?
- Where and at what speed does the impact move?
- Who and what ecosystems are at risk?
- What action is necessary and has it produced a measurable result?
Document structure
- The meaning of the project
- Scientific framework and working definition
- Mission, purpose and objectives
- Principles of the system
- Object and limits of observation
- The observation circuit
- Indicators and normative benchmarks
- Measuring network
- Data Architecture EQUILIBRIUM
- Atlas of Threats
- Algorithm of reaction
- ECO-PPA as implementation contour
- Distribution of roles
- Pilot for 12 months
- KPI and Evidence
- Risks and constraints
- Scaling
- Final decision and sources
1. The meaning of the project
Traditional air monitoring is more often organized according to individual departmental contours: meteorology, chemical pollutants, sanitary supervision, biological observations and enterprise data exist nearby, but are not always linked into a single causal picture. The project creates a cross-cutting management chain:
- to observe physical, chemical and biological factors simultaneously;
- distinguish between seasonal background, local anomaly and long-distance transfer;
- associate the measurement with a likely source and a sensitive receptor;
- to predict the development of the situation and the time of reaching vulnerable objects;
- formalize measures as verifiable projects ECO-PPA;
- check the effect of the intervention on the data before, after and in the control area.
2. Scientific framework and working definition
2.1. Why the term requires explanation
In strict ecology, biocenoses are a collection of interacting populations inhabiting a particular biotope. For a large part of organisms, the atmosphere serves as a temporary medium of transport. Therefore, it is impossible to declare the entire atmosphere as a single proven self-sustaining biocenosis. More precise scientific terms: aerobics, aerobics, atmospheric microbiome, and bioaerosol.
2.2. Working definition
"Biocenosis: Air" is the project name of a dynamic natural and man-made system, including aerobic and biological particles of the air environment, the physical and chemical matrix of the atmosphere, sources, processes of transfer and transformation, objects of influence, as well as digital and organizational mechanisms of risk prevention and management.
An aerobiome is a dynamic set of microorganisms in a given airspace, changing depending on the season, time of day, meteorological conditions, type of surface and the origin of air masses. Studies show reproducible daily and seasonal changes in the composition of the atmospheric microbiome, as well as long-range transport of microorganisms [8–12].
3. Mission, purpose and objectives
Strategic objective: To ensure continuous monitoring, forecasting and managed recovery of air quality and associated natural systems based on evidence.
- to form a multi-component picture of the air condition;
- identify chemical, physical and biological abnormalities;
- identify likely sources and routes of transfer;
- forecast the situation on the horizons 6, 24 and 72 hours;
- assess the impact on the population, plants, animals and microorganisms;
- create targeted warning and response scenarios;
- to form passports of the air environment of the territories;
- create an evidence base ECO-PPA and verify the result of each intervention;
- scale solutions from individual facility to region and cross-border space.
4. Principles of the system
- Scientific correctness: reproducible methods, quality control, field and laboratory controls.
- Harm prevention: an early signal is more valuable than a late fixation of damage.
- Multilevel: Continuous sensors are complemented by reference instruments, laboratories and remote data.
- Separation of statuses: observation, analytical hypothesis and confirmed conclusion are marked separately.
- Uncertainty: next to the forecast and index, a level of trust is published.
- Person in the loop: mandatory decisions are made by an authorized person or body.
- Compatibility: the system is built into the existing state and scientific contours.
- Evidence: Each activity is related to the starting level, purpose and verification of the result.
- Openness and protection: Anonymized environmental data is opened, sensitive information is protected.
- Non-repression of life: the goal is to manage hazardous sources and exposure, not to sterilize the outside air.
5. Object and limits of observation
The main object is the surface layer of the atmosphere and the physical, chemical and biological components circulating in it, associated with a specific territory, sources and receptors of influence. Each program specifies a geographic boundary, altitude range, season, observation period, and receptor class.
Spatial levels
- Point: school, hospital, residential yard, workplace or enterprise.
- Microzone: a neighborhood, industrial site, park or agricultural facility.
- Municipal area: city or district.
- Air pool: an area connected by common air flows.
- Regional network: municipal, industrial and background points.
- Interregional and transboundary level: long-range transport of smoke, dust, allergens and pollutants.
Functional boundaries
Outdoor air, indoor air and human breathing area do not mix in one array without marking. The internal environment is taken into account as a conjugate module, because the sources, standards and management methods are different. The system does not replace clinical diagnosis, epidemiological investigation and official authority of the authorities.
6. The observation circuit
| Level | What is observed | Management result |
|---|---|---|
| 0. Context | Relief, land use, population, sources, fires | Map of sources and receptors |
| 1. Physics | Temperature, humidity, pressure, wind, precipitation, radiation | Conditions of transport and dispersion |
| 2. Aerosol | PM1, PM2.5, PM10, particle number and size, black carbon | Intensity and type of episode |
| 3. Chemistry | NO₂/NOx, SO₂, CO, O₃, NH₃, VOCs and source markers | Profile of pollution |
| 4. Biology | Pollen, spores, bacteria, fungi, allergens, endotoxins | Aerobiome and biological load |
| 5. Ecosystems | Precipitation, plant condition, phenology, bioindicators | Environmental effect |
| 6. Exposition | Population, time of exposure, sensitive objects | Vulnerability map |
| 7. Management | Events, decisions, timing, measures, residual risk | Proof of result |
7. Indicators and normative benchmarks
7.1. Baseline indicator system
| Block | Basic indicators | Expanded indicators |
|---|---|---|
| Meteorology | Temperature, humidity, pressure, wind, precipitation | Radiation, turbulence, mixing height |
| Aerosol | PM1, PM2.5, PM10 | Ultrafine particles, dimensions, black carbon |
| Gases | NO₂/NOx, SO₂, CO, O₃, NH₃ | VOCs and profile substances |
| Aerobiota | Pollen, spores, total biological load | Bacteria, fungi, metagenomics, target markers |
| Biorisk | Allergens, endotoxin | Viability, toxins, AMR-markers |
| Effect | Plant sedimentation and condition | Phenology, biodiversity, bioindication |
| Exposition | Population and time in the area | Models of vulnerable groups without disclosure |
| System | Completeness and availability of data | Prediction accuracy, false alarms, reaction time |
7.2. WHO guidelines 2021
The WHO recommendations are a health-preventive guideline and do not replace national standards. In the official Russian assessment, the current sanitary requirements are applied; before submitting the document, it is necessary to check the current edition of SanPiN 1.2.3685-21 [1, 6].
| Component | Long-term orientation | Short-term orientation |
|---|---|---|
| PM2.5 | 5 ug/m³ | 15 ug/m³ |
| PM10 | 15 ug/m³ | 45 ug/m³ |
| NO₂ | 10 ug/m³ | 25 ug/m³ |
| O₃ | 60 ug/m³ — Peak Season | 100 ug/m³ — maximum 8-hourly average |
| SO₂ | — | 40 ug/m³ |
| CO | — | 4 mg/m³ |
Note: WHO daily levels are reported as the 99st percentile, not the absolute maximum. For ozone, a separate logic of the peak season and the eight-hour average [1] is used.
7.3. Indices
- Physical and chemical air quality index;
- Aerobiota status index;
- Exposure safety index;
- Sustainability index and regenerative capacity of the territory.
8. Measuring network
The network is built on the principle of "reference kernel" + Distributed nodes + Laboratory + Mobile Outline + "Model and Aerospace Data." Low-budget sensors do not receive regulatory measurement status automatically: co-location with support equipment, correction of humidity and temperature influences, maintenance and recalibration are necessary3, 5].
- one reference-level reference station or integration with an existing one;
- 10–15 distributed sensor nodes;
- 3–5 bioaerosol and pollen sampling posts;
- one background control point;
- mobile measuring complex and route surveys;
- reference laboratory and confirmatory laboratories;
- episodic vertical profiling;
- satellite, model and meteorological data.
Methods of biological contour
Pollen and spores are determined by microscopy or automated methods; bacteria and fungi by quantitative PCR, 16S/ITS-profiling and, according to a reasonable program, metagenomics. Viability, cultivability, metabolic activity, toxigenicity and infectiousness are evaluated by separate methods. Field, transport and laboratory controls are mandatory for low-mass samples.
9. Data Architecture EQUILIBRIUM
| Layer | Function |
|---|---|
| 1. Receipt | Stationary and mobile devices, laboratories, remote sensing, weather data, bioindication. |
| 2. Border processing | Check the range, state of the device, time, communication and primary anomalies. |
| 3. Integration | Units of measurement, directories of substances, taxa, sources and territories. |
| 4. Storage | Time series, geodata, laboratory results, spectra, images and model versions. |
| 5. Semantic Hypergraph | Connection of territory, station, sample, substance, taxon, source, receptor, event, decision and result. |
| 6. Analytics | Anomalies, reverse trajectories, source classification, exposure, risk and digital twin. |
| 7. Management | Situation screen, risk card, notifications, event card, public impersonal card. |
Passport Measurement
- unique identifier, date, time, coordinates and height;
- Method, unit of measure, detection limit and calibration;
- uncertainty assessment, quality sign and algorithm version;
- origin of data and full log of changes;
- for the sample - selector, packaging, transport and storage chain.
10. Atlas of Threats
| Scenario | Signals | Main actions |
|---|---|---|
| Industrial emissions | Specific gases, particles or elements + wind | Confirmation, localization, verification of the source |
| Transport Episode | NOx, CO, black carbon, ultrafine particles | Protection of objects, flow management |
| Fire and smoke | PM2.5, CO, organic components, satellite hearth | Forecasting, warning, filtration |
| Dust | PM10, mineral composition, dry weather | Dust and work regime |
| Inversion | Weak wind, low mixing layer, accumulation | Prevention and temporary reduction of emissions |
| Pollen and Disputes | Taxa growth + phenology + weather conditions | Allergenic forecast and filtration modes |
| Agriculture/waste | NH₃, organic dust, endotoxin, biomarkers | Re-selection and source survey |
| Unusual Biosignal | Target Marker Cluster | Closed circuit, reference confirmation, competent authorities |
| Long-distance transfer | Synchronous growth in several territories | Interregional forecast and data exchange |
| Data substitution | Impossible values, mismatch, signature violation | Node isolation, audit, reservation |
11. Algorithm of reaction
Step 1. Detect
Normative excess, deviation from the seasonal background, a combination of signals or a forecast of dangerous development.
Step 2. Check the quality
Instrument health, calibration, humidity, neighboring nodes and meteorological plausibility.
Step 3. Verify
Independent method, re-selection, reference laboratory and verification of operations at the source.
Step 4. Assess the risk
Hazard × exposure × vulnerability; trust and urgency are specified separately.
Step 5. Set Source
Wind, reverse trajectories, source register, profiles and mobile survey.
Step 6. Predict
Area of impact and sensitive objects on the horizon 6, 24 and 72 Hours.
Step 7. Make a decision
Green, yellow, orange or red; action approved by competent authority.
Step 8. Check the effect
Before/after comparison, control area, comparable weather and residual risk.
Step 9. Close and learn
The final card of the event, the reason, the effectiveness, the update of the model and regulations.
12. ECO-PPA as implementation contour
ECO-PPA converts observations into funded prevention and recovery packages. Each packet receives a passport linking the problem, the baseline, the solution, the resources, the deadline, and the proof of outcome.
- problem, source and baseline;
- target result and technical or organizational solution;
- responsible participants and the amount of resources;
- funding scheme and outcome indicators;
- methodology of monitoring, reporting and verification;
- terms, grounds for continuation and stop conditions;
- residual risk and data access rules.
13. Distribution of roles
| Participant | Main role |
|---|---|
| EQUILIBRIUM | Unified data model, hypergraph, digital twin, forecast, register of events and evidence. |
| ECO-PPA | Intervention projects, resource pooling, KPI, result monitoring and independent verification. |
| SPECZASHCHITA | Execution operator: surveys, network, mobile groups, interaction with enterprises and events. |
| Authorities | Official decisions, warnings and actions are strictly within the competence. |
| Scientific Council | Methods, thresholds, scientific correctness and revision of models. |
| Labs | Confirmatory research, quality control and storage chain. |
| Owners of Sources | Data, prevention, elimination of causes and implementation of prescribed measures. |
| Independent Verifier | Checking the result of the events ECO-PPA. |
| IAC | Interdepartmental analytics, decision-making and strategic scaling. |
14. Pilot for 12 months
The pilot is selected on the territory where residential, natural, transport and production zones are combined, there are sensitive objects, a background point, a laboratory partner and the readiness of the authorities. One year covers the seasonal cycle, but does not form a multi-year climate norm.
| Months | Stage | Key works | Result |
|---|---|---|---|
| 1–2 | Design | Source and receptor map; protocol; quality plan; agreements | Pilot's passport |
| 3–4 | Deployment | Installation, laboratories, platform, co-location of sensors | Working Outline |
| 5–6 | Input | Calibration, background maps, thresholds, test notifications | Suitability of data |
| 7–8 | Analysis | Seasonal profile, sources, exposure, transfer model | Territory model |
| 9–10 | Interference | 2–3 projects: dust, source, filtration or pollen | Proof of manageability |
| 11 | Exercises and Audit | Chemical and biological scenarios, reaction testing | Operational readiness |
| 12 | Result | Report, economics, standards and architecture of the second stage | Multiplier Package |
Proposed pilot areas
- the background natural point;
- residential and public area;
- transport corridor;
- industrial or municipal area;
- agricultural facility;
- A sensitive receptor is a school, hospital, or social institution.
15. KPI and evidentiary value
Below are the project targets for discussion. They are approved after the survey of the territory, the choice of equipment and the coordination of the methodology.
| Block | Project objective | Method of confirmation |
|---|---|---|
| Technical | ≥90% Validated data of the reference contour; ≥95% Mandatory Metadata | Journal of Quality and Audit |
| Scientific | ≥80% significant events confirmed by independent channel | Reference-check |
| Sources | Source class defined for a minimum of 70% significant episodes | Trajectories and profiles |
| Forecast | Main impact area projected at 6 hours | Comparison of forecast and fact |
| Operations | Initial evaluation of the orange event — up to 30 minutes | Event Log |
| Interference | At least three packages ECO-PPA | Before/after/control |
| Readiness | At least two comprehensive exercises | Independent audit |
16. Risks and constraints
| Risk | Control measure |
|---|---|
| Controversy of the term | The public name is retained; aerobics and bioaerosol are used in TK. |
| Sensor Errors | Co-location, calibration, wet correction and standby measurements. |
| DNA = Danger | The presence, viability, activity and infectivity are separately indicated. |
| One Seasonal Cycle | Continued monitoring; ban on conclusions about the long-term trend. |
| False alarms | Multi-step validation and mandatory level of trust. |
| Conflict of authority | The responsibility matrix and the agreement before launch. |
| Panic | Unified protocol of risk communication; separation of pre- and confirmed signal. |
| Sensitive data | Access Delimitation, Logging, and Protected Outline. |
| Data substitution | Digital signature, reservation and anomaly control. |
| Dependence on supplier | Open interfaces, export and data portability. |
| Exaggerated effect | Scenario evaluations and independent verification. |
17. Roadmap for scaling
| Stage | Timeframe | Result |
|---|---|---|
| 1. Methodology | 0–3 months | Glossary, indicators, data model, instruments, laboratories, regulations and template ECO-PPA. |
| 2. Pilot | 4–15 months | Full seasonal cycle, digital twin, interventions, audit and replication package. |
| 3. Network of Pilots | 16–30 months | City, industry, agriculture, natural and northern territories. |
| 4. Regional Standard | 31–48 months | Single center, integration of departments, exchange standard and inter-municipal scenarios. |
| 5. National outline | 49–60 months | Network of air pools, GASMP "EQUILIBRIUM" and international cooperation. |
18. Final decision and sources
18.1. Launch Solution
- approve the two-level name: "Biocenosis: Air" / "Monitoring of aerobic and biological factors of air quality";
- determine the customer of the pre-project stage and the owner of the result;
- choose a pilot territory and a reference laboratory;
- 60 days to prepare a scientific protocol, a map of sources and receptors, network architecture and data quality plan;
- Agree on a matrix of authority and response rules;
- launch 12-month pilot with independent verification and packages ECO-PPA.
18.2. Status of the document
The document is conceptual and is intended for pre-project discussion. Threshold values, equipment composition, legal model, budget and official regulations are approved after the territory is surveyed, consultations with authorized bodies and verification of current regulatory requirements.
18.3. Main sources
[1] WHO. Global Air Quality Guidelines (2021). https://www.who.int/publications/i/item/9789240034228
[2] WMO. Global Atmosphere Watch Programme. https://community.wmo.int/site/knowledge-hub/programmes-and-initiatives/global-atmosphere-watch-gaw-programme
[3] UNEP. GEMS/Air. https://www.unep.org/topics/environment-under-review/gems-air
[4] Copernicus Atmosphere Monitoring Service. Global atmospheric composition forecasts. https://ads.atmosphere.copernicus.eu/datasets/cams-global-atmospheric-composition-forecasts
[5] European Environment Agency. European Air Quality Index. https://airindex.eea.europa.eu/AQI/index.html
[6] SanPiN 1.2.3685-21. Official publication. https://publication.pravo.gov.ru/Document/View/0001202102030022
[7] Roshydromet. Air pollution status yearbooks. https://www.meteorf.gov.ru/product/infomaterials/ezhegodniki/
[8] Gusareva et al. Short-timescale dynamics of the airborne microbiome. PNAS, 2019. https://doi.org/10.1073/pnas.1908493116
[9] Gusareva et al. Seasonal and diurnal variations of airborne microbiomes in Western Siberia. Scientific Reports, 2020. https://doi.org/10.1038/s41598-020-78604-8
[10] Mayol et al. Long-range transport of airborne microbes over the global tropical and subtropical ocean. Nature Communications, 2017. https://doi.org/10.1038/s41467-017-00110-9
[11] Vaïtilingom et al. Potential impact of microbial activity on the oxidant capacity and organic carbon budget in clouds. PNAS, 2013. https://doi.org/10.1073/pnas.1205743110
[12] Archer et al. Air mass source drives bacterial and fungal community composition above the Great Barrier Reef. ISME Journal, 2020. https://doi.org/10.1038/s41396-019-0555-0
[13] WHO, FAO, UNEP, WOAH. One Health Joint Plan of Action. https://www.who.int/publications/i/item/9789240059139
Source materials
Originals and versions of the document
- Биоценоз_Воздух_Концепция.docxDOCX · main document
- Биоценоз_Воздух_Презентация.pptxPPTX · related version
Other editions in web format
Each version is disclosed separately; the sequence of the source document is saved.
BIOCENOSIS OF AIRBiocenosis_Air_Presentation.pptx · web text+
Aerobiom • Quality of environment • Early Warning
EQUILIBRIUM — ECO-PPA — SPECZASHCHITA
ORION22:22 | Version 1.0 | 26.08.2026
From measuring pollution to managing the viability of the territory
Air is a medium of communication, not a void.
SCIENTIFIC AND CRAFTS CONCEPT
ATMOSPHERE
SOURCE
RECEPTOR
Gases • Particles • Drops
pollen • spores • microorganisms
Soil • Water • Plants
City • production
Human • Plants
animals • ecosystems
Air change is quickly becoming an effect - local or carried thousands of kilometers.
BIOCENOSIS: AIR
BIOCENOSIS: AIR
SCIENTIFIC AND CRAFTS CONCEPT
The public name is strong - the scientific core is accurate
PROJECT NAME
SCIENTIFIC OBJECT
Aerobiom
SCIENTIFIC RESERVATION
dynamic set of microorganisms in a given airspace
DNA
≠ Viability
≠ activity
≠ Infectious
Bioaerosol
biological particles, including pollen, spores and inanimate fragments
BIOCENOSIS: AIR
Disjointed data captures the fact - but does not close the cycle
SCIENTIFIC AND CRAFTS CONCEPT
CHEMISTRY
METEO
BIOLOGY
PM • gases • VOC
wind • precipitation • inversion
pollen • spores • markers
SOURCE
ACTION
EFFECT
Control space
Need a single chain: measurement → source → forecast → action → proven result
BIOCENOSIS: AIR
New logic closes the observation in action
SCIENTIFIC AND CRAFTS CONCEPT
SOURCE
TRANSFER
EXPOSITION
EFFECTS
TRAINING
EFFECT
ACTION
RISK
Each cycle ends with a result check and updates the territory model.
BIOCENOSIS: AIR
Eight layers form a single air passport
SCIENTIFIC AND CRAFTS CONCEPT
CONTACTS
relief • sources • receptors
PHYSICS
temperature • wind • humidity • precipitation
AEROSOL
PM1 • PM2.5 • PM10 • black carbon
CHEMISTRY
NO₂ • O₃ • SO₂ • CO • NH₃ • VOC
BIOLOGY
Pollen • Disputes • bacteria • mushrooms • Allergens
ECOSYSTEMS
Deposition • plants • phenology • bioindicators
EXPOSITION
Population • time • vulnerable objects
GOVERNANCE
Event • solution • measure • residual risk
BIOCENOSIS: AIR
Scale - from the breathing zone to the air pool
SCIENTIFIC AND CRAFTS CONCEPT
POINT
School • Hospital • Enterprise
MICROZONE
district • park • industrial site
CITY
Municipal Map of Sources
AIR POOL
Unified Flows and Transfer
REGION / TRANSBOUNDARY
long-range smoke • dust • allergens
Vertical: Breath → roof → profile → satellite
BIOCENOSIS: AIR
Indicators combine chemistry, aerosol and biology
SCIENTIFIC AND CRAFTS CONCEPT
PHYSICS + METEO
CHEMISTRY
wind • humidity • radiation
Mixing layer
NO₂ • O₃ • SO₂ • CO
NH₃ • VOC
PASSPORT
AIR
AEROSOL
BIOLOGY
PM1 • PM2.5 • PM10
Dimensions • black carbon
pollen • spores • allergens
bacteria • mushrooms
Normative excess and confirmed biorisk are shown separately - the average index does not hide them.
BIOCENOSIS: AIR
The network grows from a reference kernel to distributed nodes
SCIENTIFIC AND CRAFTS CONCEPT
BIOAIROZOLE
LABORATORY
CENTRAL Knots
3–5 posts
confirmation
10–15 points
DZZ + METEO
Satellite •
REFERENT
NUCLEAR
FONDON POINT
MOBILE CONTOUR
control of the territory
routes • sources
BIOCENOSIS: AIR
EQUILIBRIUM Connects measurement with source and solution
SCIENTIFIC AND CRAFTS CONCEPT
RECEIVED
Sensors • Laboratory •
MEASUREMENT
QUALITY
Calibration • Range • Time
INTEGRATION
units • directories • geodata
HYPERGRAPH
sample ↔ source ↔ receptor ↔ event
ANALYTICS
anomaly • trajectory • exposure
FORECAST
6 • 24 • 72 Hours + Trust
GOVERNANCE
notification • measure • effect
DECISION
BIOCENOSIS: AIR
Atlas of threats turns an episode into a testable script
SCIENTIFIC AND CRAFTS CONCEPT
EMISSIONS
Specific gases + wind
SIGNAL
DHMM
PM2.5 + CO + satellite hearth
VERIFICATION
PILS
PM10 + mineral profile
ACTION
INVERSION
weak wind + accumulation
FILMS / DISPUTES
Taxa + Phenology
The preliminary and confirmed signals are shown separately.
BIOSIGNAL
a Cluster of Target Markers
BIOCENOSIS: AIR
The reaction passes through nine verifiable steps
SCIENTIFIC AND CRAFTS CONCEPT
Detect
Verify
Quality
Verify
Rate
Risk
Install
Source
Predict
Accept
decision
Verify
effect
Close and
Learned
R = Danger × Exposure × Vulnerability | Trust and Urgency Are Specified Separately
BIOCENOSIS: AIR
Roles are divided — responsibility is not blurred
SCIENTIFIC AND CRAFTS CONCEPT
EQUILIBRIUM
Data • hypergraph • prediction • proofs
ECO-PPA
projects • resources • KPI • verification
SPECZASHCHITA
survey • network • execution • mobile groups
STATE
Formal decisions within the competence
SCIENCE + LABORATORY
methods • confirmation • quality control
Unified methodology • distributed surveillance • responsible execution • independent verification
BIOCENOSIS: AIR
Pilot in 12 months gives first seasonal cycle
SCIENTIFIC AND CRAFTS CONCEPT
PROJECT
NETWORKING
ENTER
MODEL
MEASURES
AUDIT
9–10
11–12
map • protocol
installation • integration
Calibration • Background
Sources • exposure
2–3 interventions
Exercises •
Territory passport • early warning • proof of manageability • scaling package
Result
One year covers the season, but does not form a multi-year climate norm.
BIOCENOSIS: AIR
≤30 min
SCIENTIFIC AND CRAFTS CONCEPT
Success is data quality, speed and proven effect
PROJECT OBJECTIVES FOR DISCUSSION
Valid Data
the reference contour
significant events
Verified
Primary Assessment
the Orange Event
At least three intervention packages ECO-PPA
Each orange and red signal receives a final card
Source class defined for most significant episodes
The effect is confirmed by comparison before / after / control
The long-term reduction in incidence is not reported as KPI per year pilot.
BIOCENOSIS: AIR
Launch the pre-project stage
DECISION
DAYS
Results of the stage
pilot territory and reference laboratory
Map of sources, flows and sensitive receptors
Scientific protocol and data quality plan
BIOCENOSIS: AIR
Network architecture, roles and response regulations
Transition from pollution measurement
Managing the viability of the Territory
passport 12-month pilot ECO-PPA
EQUILIBRIUM — ECO-PPA — SPECZASHCHITA
ORION 22:22
Sources indicated in the presentation 26
- Visual: original OpenAI ImageGen scientific editorial illustration generated for this deck, 2026-08-26.
- WMO Global Atmosphere Watch: https://community.wmo.int/site/knowledge-hub/programmes-and-initiatives/global-atmosphere-watch-gaw-programme
- Mayol et al., Nature Communications 2017: https://doi.org/10.1038/s41467-017-00110-9
- Gusareva et al., PNAS 2019: https://doi.org/10.1073/pnas.1908493116
- Gusareva et al., Scientific Reports 2020: https://doi.org/10.1038/s41598-020-78604-8
- Vaïtilingom et al., PNAS 2013: https://doi.org/10.1073/pnas.1205743110
- UNEP GEMS/Air: https://www.unep.org/topics/environment-under-review/gems-air
- CAMS global forecasts: https://ads.atmosphere.copernicus.eu/datasets/cams-global-atmospheric-composition-forecasts
- Concept synthesis from the project architecture.
- Project operating model; no external quantitative claim.
- WHO Global Air Quality Guidelines: https://www.who.int/publications/i/item/9789240034228
- WHO/FAO/UNEP/WOAH One Health Joint Plan: https://www.who.int/publications/i/item/9789240059139
- Project layer model synthesized from official monitoring and aerobiome research.
- WMO Global Atmosphere Watch network framework: https://community.wmo.int/site/knowledge-hub/programmes-and-initiatives/global-atmosphere-watch-gaw-programme
- European Air Quality Index station typology: https://airindex.eea.europa.eu/AQI/index.html
- WHO Global Air Quality Guidelines (2021): https://www.who.int/publications/i/item/9789240034228
- CAMS pollen forecasts: https://atmosphere.copernicus.eu/european-air-quality-forecast-plots
- European Air Quality Index: https://airindex.eea.europa.eu/AQI/index.html
- Proposed node counts are project design targets requiring site survey and calibration.
- Project-specific semantic hypergraph and evidence architecture.
- Threat taxonomy is a project scenario framework.
- Project response protocol synthesized from environmental monitoring, quality assurance and One Health principles.
- Project governance proposal; official powers remain with competent public authorities.
- Project pilot roadmap and design assumptions; duration and node mix require site-specific approval.
- All KPI values shown are project targets for discussion, not externally validated outcomes.
- Project decision proposal; no external quantitative claim.